Table of Contents
- Prerequisites
- AWS Cloudwatch Logs Insight Introduction
- Logs Insight Supported logs and discovered fields
- Exploring Logs Insight Cloudwatch Dashboard
Prerequisites
An AWS Account An IAM User with:
- AWS Management Console access
- The IAM permissions required to perform IAM, EC2, and CloudWatch activities.
- IAM policy creation and AWS Application Programming Interface (API) permissions are outside this article’s scope. Always adhere to the principle of least privilege when authorizing accounts to perform actions. Administrative access to an EC2 Instance.
AWS Cloudwatch Logs Insight Introduction
CloudWatch Logs Insights enables you to interactively search and analyze your log data in Amazon CloudWatch Logs. You can perform queries to help you more efficiently and effectively respond to operational issues. If an issue occurs, you can use CloudWatch Logs Insights to identify potential causes and validate deployed fixes.
CloudWatch Logs Insights includes a purpose-built query language with a few simple but powerful commands. CloudWatch Logs Insights provides sample queries, command descriptions, query autocompletion, and log field discovery to help you get started. Sample queries are included for several types of AWS service logs.
CloudWatch Logs Insights automatically discovers fields in logs from AWS services such as Amazon Route 53 , AWS Lambda, AWS CloudTrail, and Amazon VPC, and any application or custom log that emits log events as JSON.
You can use CloudWatch Logs Insights to search log data that was sent to CloudWatch Logs on November 5, 2018 or later.
A single request can query up to 20 log groups. Queries time out after 15 minutes, if they have not completed. Query results are available for 7 days.
You can save queries that you have created. This can help you run complex queries when you need, without having to re-create them each time that you want to run them.
CloudWatch Logs Insights queries incur charges based on the amount of data that is queried. For more information, see Amazon CloudWatch Pricing here
Logs Insight Supported logs and discovered fields
CloudWatch Logs Insights supports all types of logs. For every log sent to CloudWatch Logs, five system fields are automatically generated:
@message contains the raw unparsed log event. This is equivalent to the message field in InputLogevent.
@timestamp contains the event timestamp contained in the log event's timestamp field. This is equivalent to the timestamp field in InputLogevent.
@ingestionTime contains the time when the log event was received by CloudWatch Logs.
@logStream contains the name of the log stream that the log event was added to. Log streams are used to group logs by the same process that generated them.
@log is a log group identifier in the form of account-id:log-group-name. This can be useful in queries of multiple log groups, to identify which log group a particular event belongs to.
CloudWatch Logs Insights inserts the @ symbol at the start of fields that it generates.
For many log types, CloudWatch Logs also automatically discovers the log fields contained in the logs. These automatic discovery fields are shown in the following table.
For other types of logs with fields that CloudWatch Logs Insights doesn't automatically discover, you can use the parse command to extract and create ephemeral fields for use in that query.
If the name of a discovered log field starts with the @ character, CloudWatch Logs Insights displays it with an additional @ appended to the beginning. For example, if a log field name is @example.com, this field name is displayed as @@example.com.
Exploring Logs Insight Cloudwatch Dashboard.
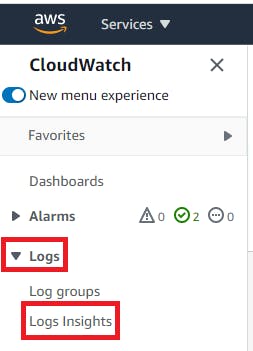
Goto Cloudwatch Console -> Logs -> Logs Insight.

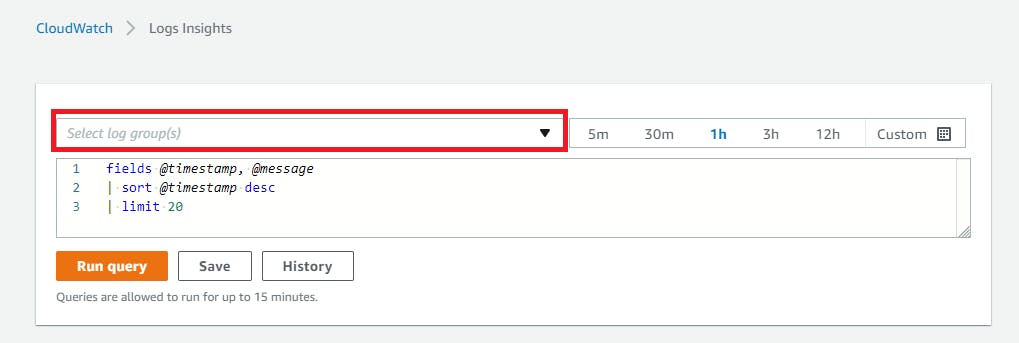
On Logs Insight dashboard you have to select log group for which you want to analyze/visualize data.
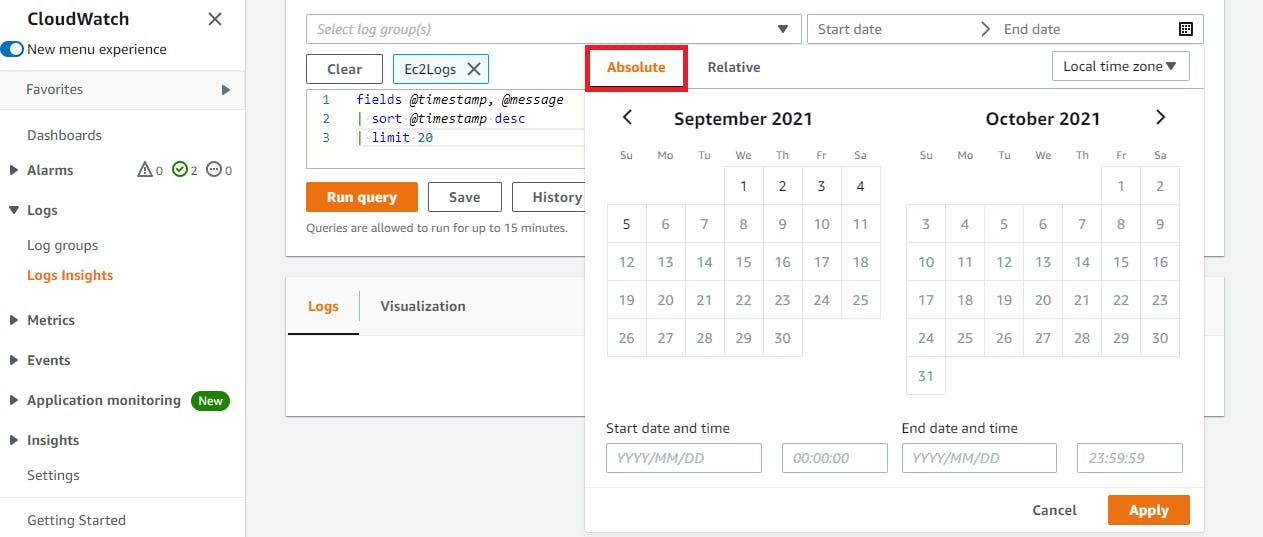
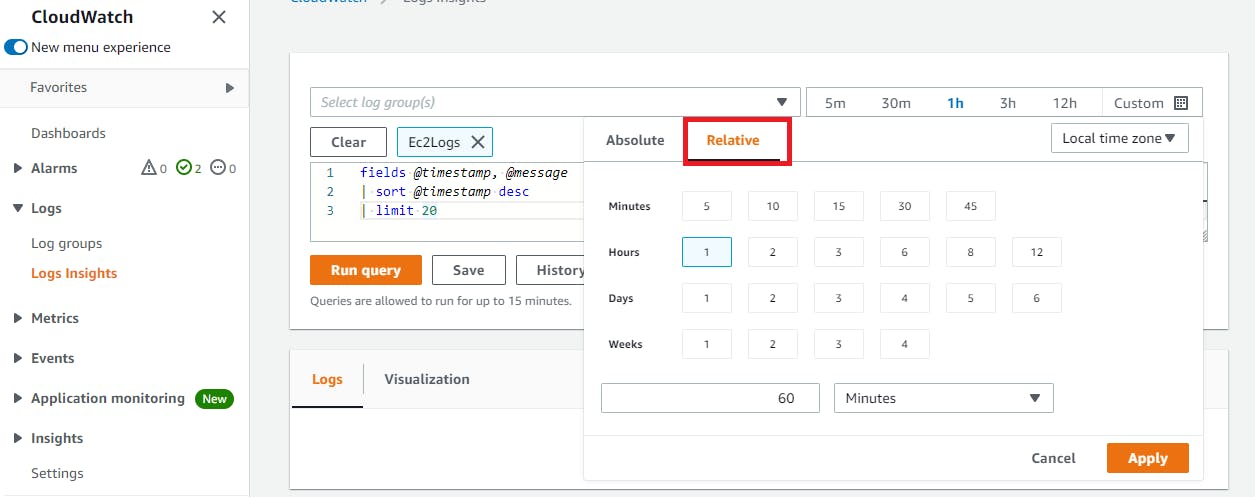
You can search based on absolute or relative timestamp.
We have 5 types of log type as listed below. All different type of log type have different field discoverable as you can see below. Sample queries for these log types are as follows
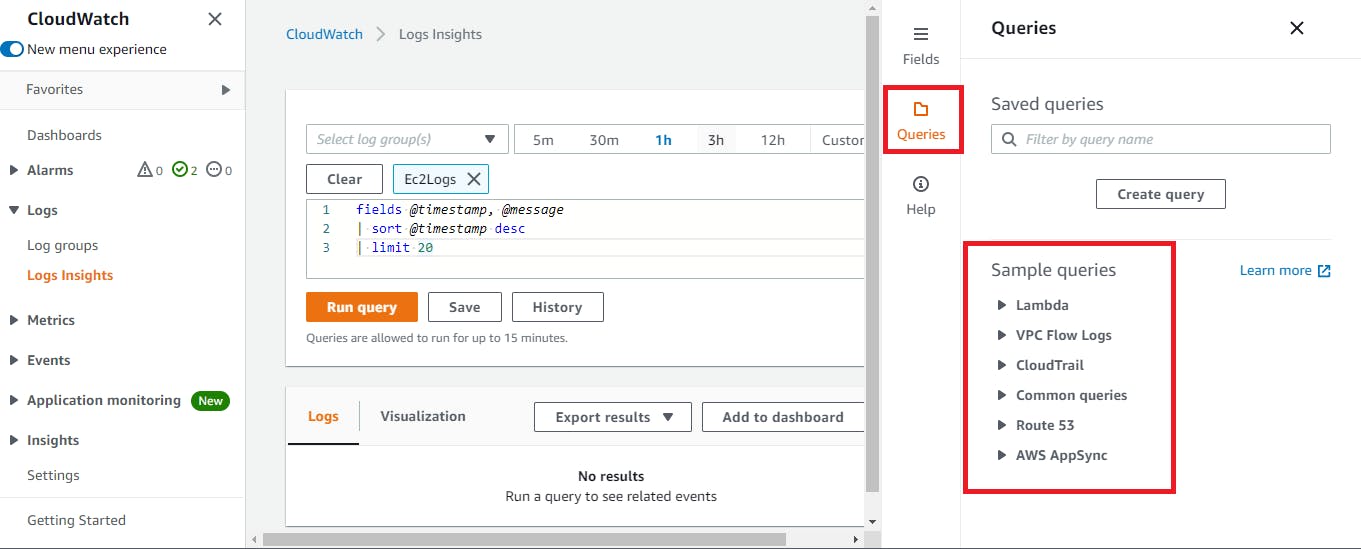 a) Lambda logs :- @timestamp, @logStream, @message, @requestId, @duration, @billedDuration, @type, @maxMemoryUsed, @memorySize
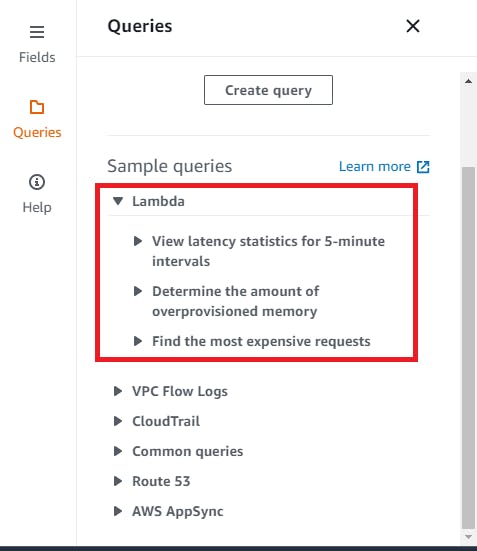 Example:- View latency statistics for 5-minute intervals
filter @type = "REPORT"
| stats avg(@duration), max(@duration), min(@duration) by bin(5m)
b) Amazon VPC flow logs :- @timestamp, @logStream, @message, accountId, endTime, interfaceId, logStatus, startTime, version, action, bytes, dstAddr, dstPort, packets, protocol, srcAddr, srcPort
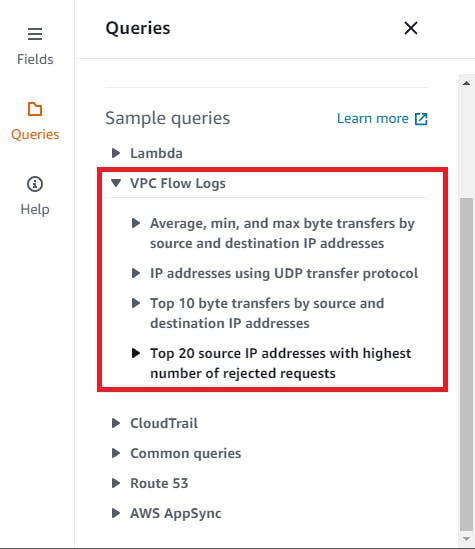 Example:- Average, min, and max byte transfers by source and destination IP addresses
stats avg(bytes), min(bytes), max(bytes) by srcAddr, dstAddrc) CloudTrail logs :- CloudWatch Logs Insights represents nested JSON fields using the dot notation. In the following example JSON event, the field type in the JSON object userIdentity is represented as userIdentity.type.
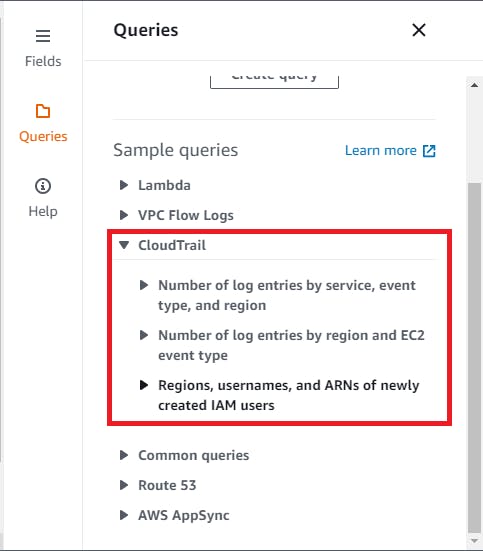 Example:- Number of log entries by service, event type, and region
stats count(*) by eventSource, eventName, awsRegiond) Route 53 logs :- @timestamp, @logStream, @message, edgeLocation, hostZoneId, protocol, queryName, queryTimestamp, queryType, resolverIp, responseCode, version
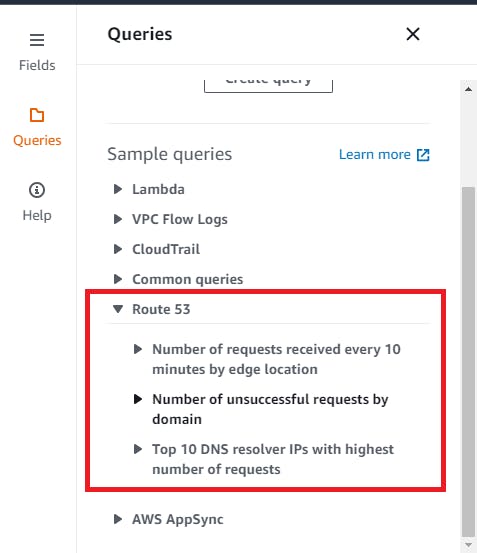 Example:- Number of requests received every 10 minutes by edge location
stats count(*) by queryType, bin(10m)e) Other log types :- @timestamp, @ingestionTime, @logStream, @message, @log.
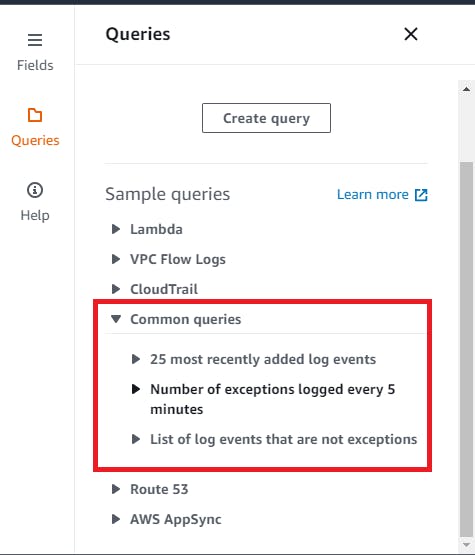 Example:- 25 most recently added log events
fields @timestamp, @message
| sort @timestamp desc
| limit 25
List of commands or query syntax listed below is also displayed for your reference as listed below in dashboard.
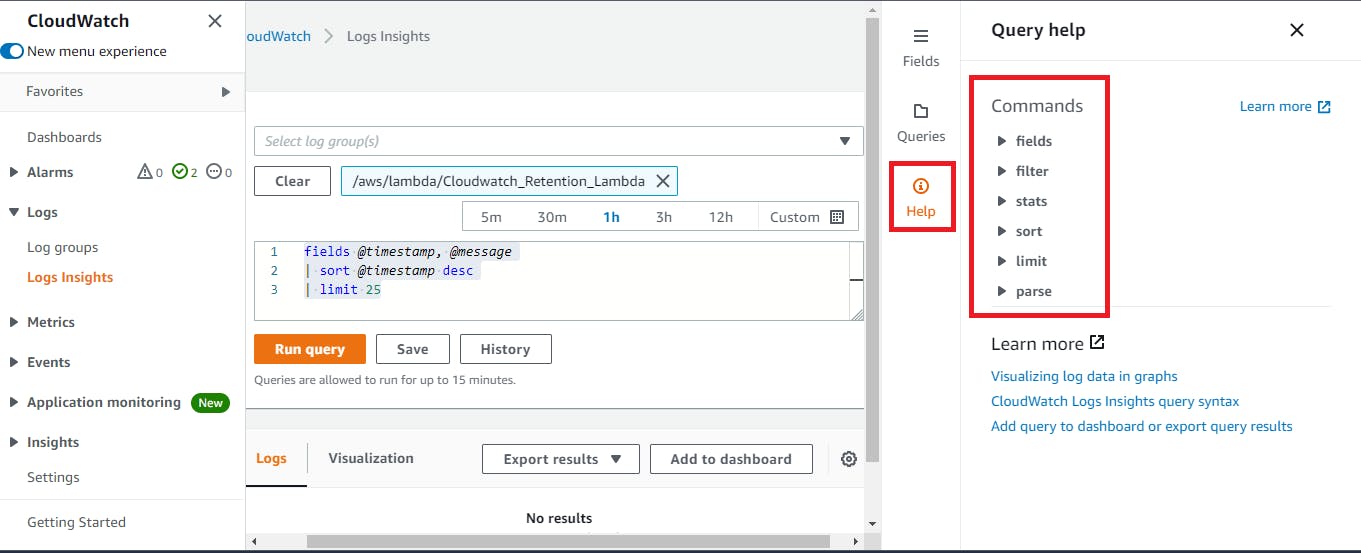 a) fields :- Retrieve one or more log fields. You can also use functions and operations such as abs(a+b), sqrt(a/b), log(a)+log(b), strlen(trim()), datefloor(), isPresent(), and others in this command.
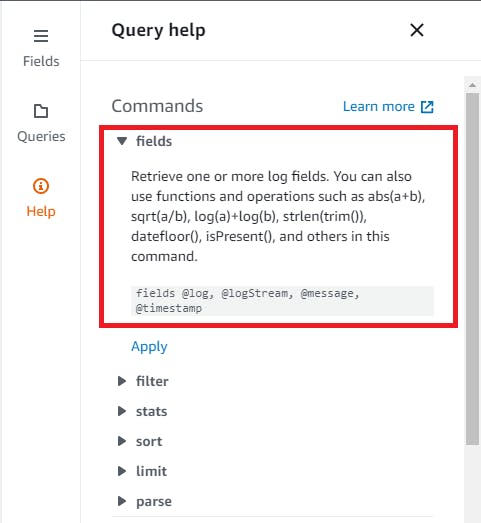
fields @timestamp, @message
| sort @timestamp desc
| limit 20  | fields @log, @logStream, @message, @timestamp
b) filter :- Retrieve log fields based on one or more conditions. You can use comparison operators such as =, !=, >, >=, <, <=, boolean operators such as and, or, and not, and regular expressions in this command.
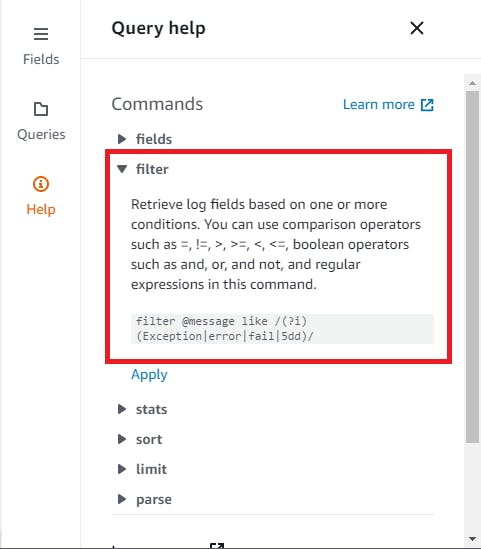
fields @timestamp, @message
| sort @timestamp desc
| limit 20 | filter @message like /(?i)(Exception|error|fail|5dd)/
c) stats :- Calculate aggregate statistics such as sum(), avg(), count(), min() and max() for log fields.
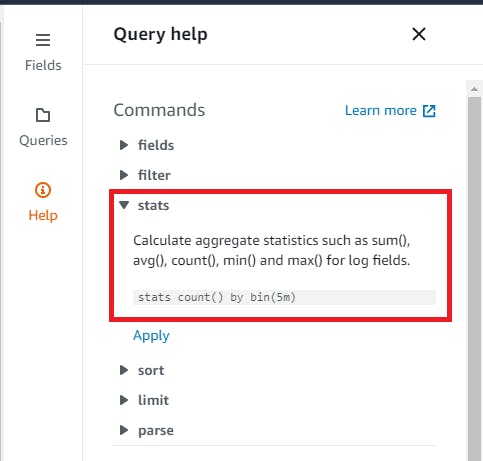
fields @timestamp, @message
| sort @timestamp desc
| limit 20 | stats count() by bin(5m)
d) sort :- Sort the log fields in ascending or descending order.
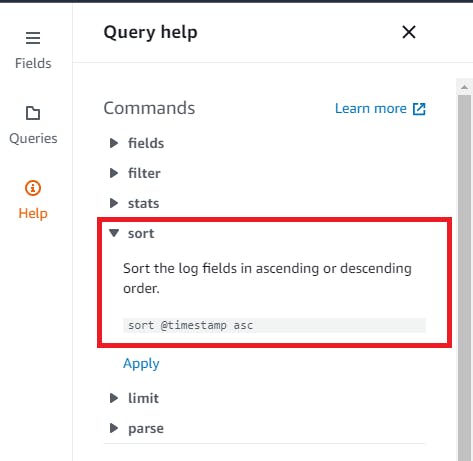
Sort the log fields in ascending or descending order.e) limit :- Sort the log fields in ascending or descending order.
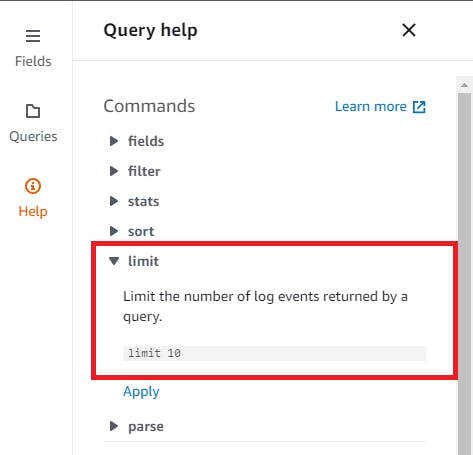
fields @timestamp, @message
| sort @timestamp desc
| limit 20
f) parse :- Create one or more ephemeral fields, which can be further processed by the query. The following example will extract the ephemeral fields host, identity, dateTimeString, httpVerb, url, protocol, statusCode, bytes from @message, and return the url, max(bytes), and avg(bytes) fields sorted by max(bytes) in descending order.
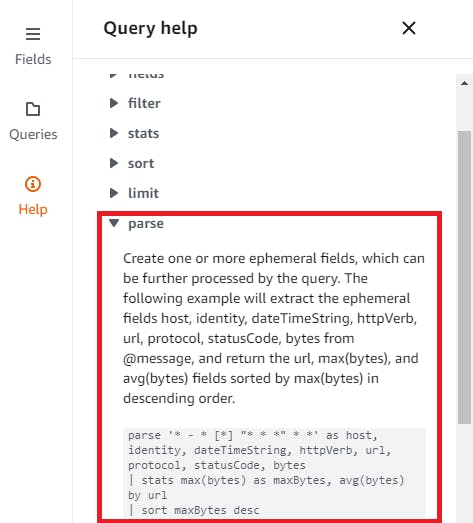
parse '* - * [*] "* * *" * *' as host, identity, dateTimeString, httpVerb, url, protocol, statusCode, bytes
| stats max(bytes) as maxBytes, avg(bytes) by url
| sort maxBytes desc
To understand these command in more depth refer AWS official documentation here
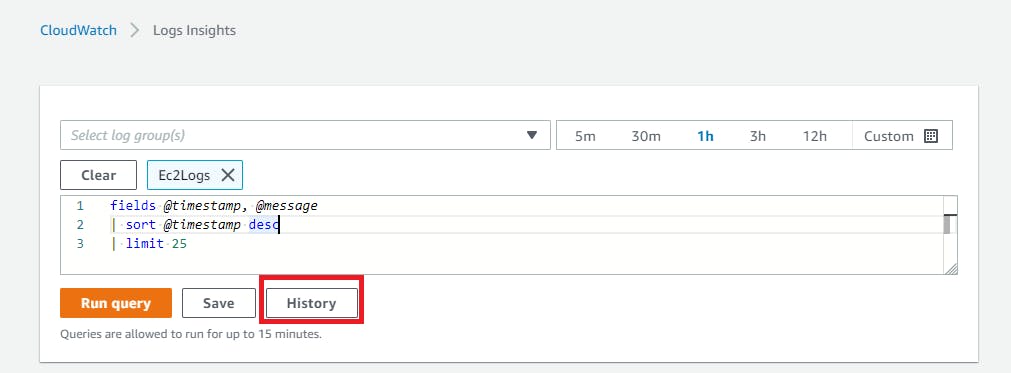
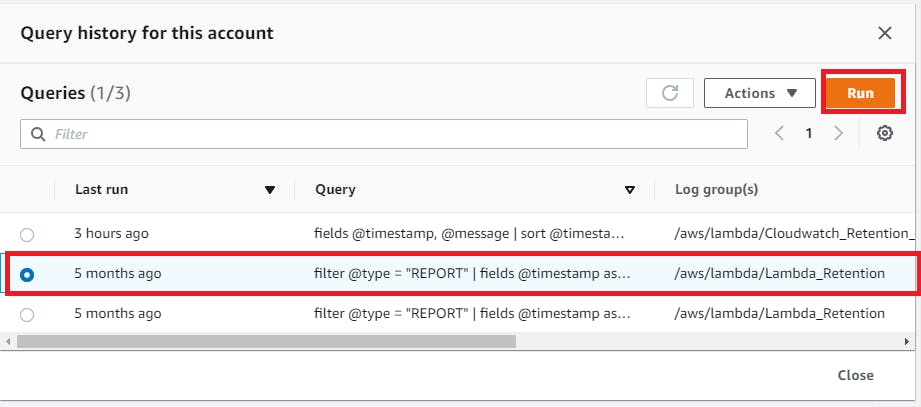
In history we can view your previously executed queries and it can be run again.
- Query output of logs can also be exported by using "export results" dropdown.
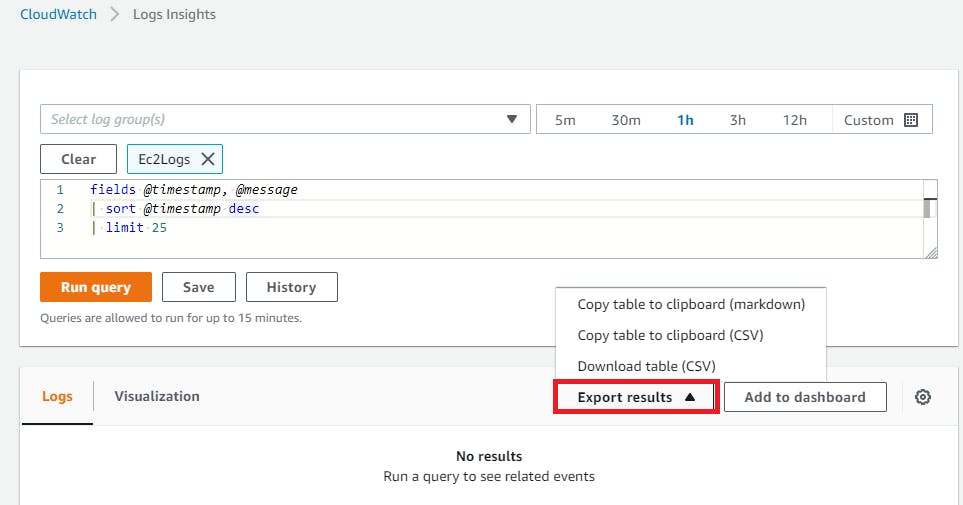
- Fetched query output data can also be visualized in Line,Stacked area, Bar,Pie graphs.
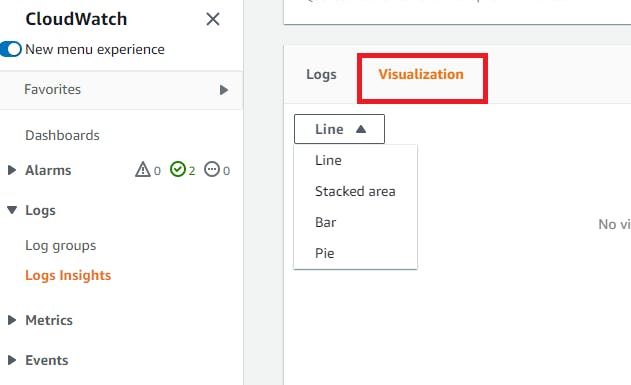
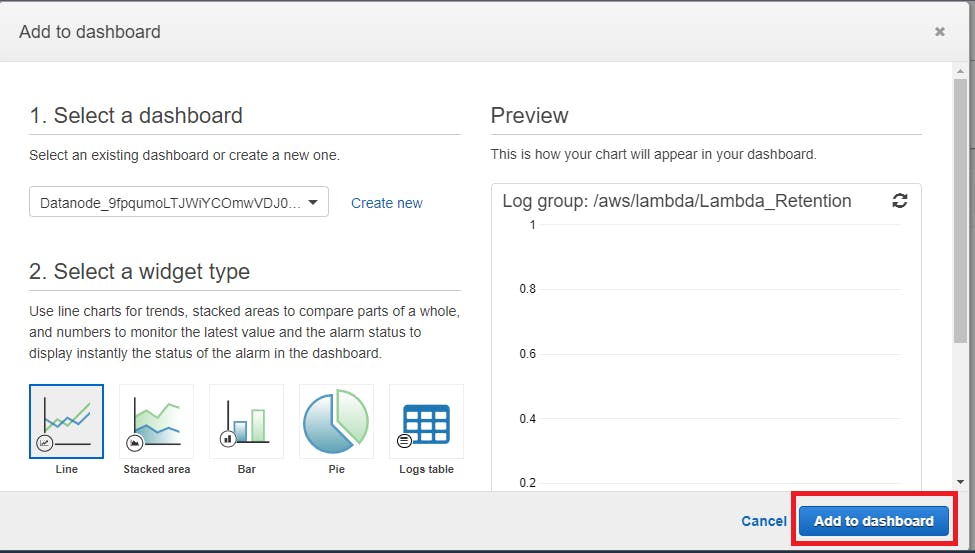
- These visualized output can also be added to your dashboard by clicking on "Add to dashboard"

Conclusion
AWS Cloudwatch logs insight is a very powerful option to analyze,troubleshoot and visualize your daily logs which is streamed to cloudwatch log groups. Its query syntax functionality is a robust cloud native functionality.
Stay tuned, for my next blogs..
