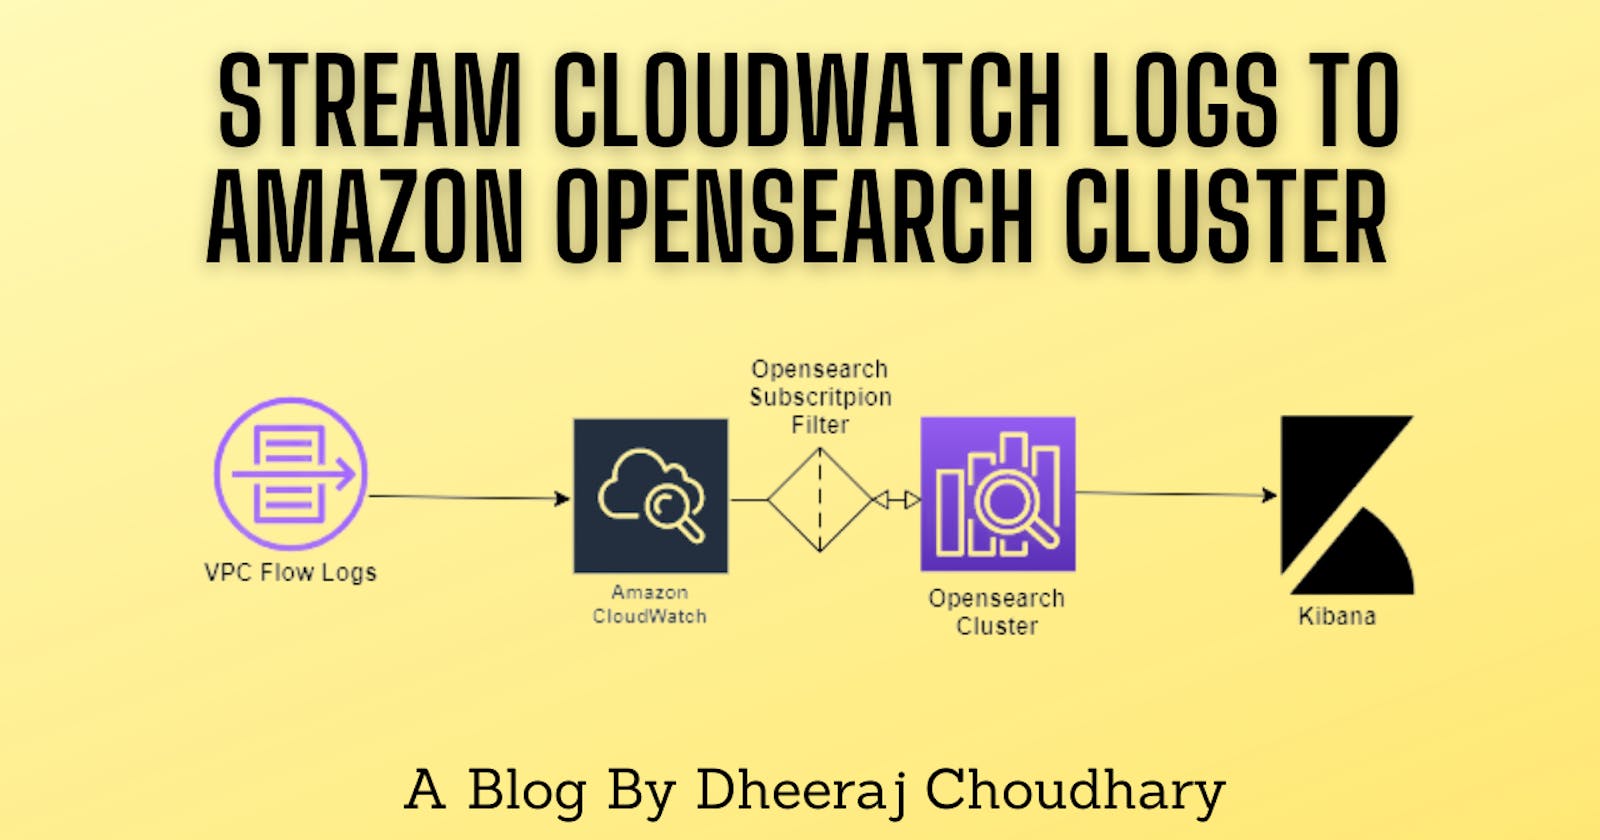
Stream AWS Cloudwatch Logs to Amazon OpenSearch Service (successor to Amazon Elasticsearch Service)
Amazon OpenSearch Service (successor to Amazon Elasticsearch Service) is a managed service that makes it easy to deploy, operate, and scale OpenSearch clusters in the AWS Cloud. Amazon OpenSearch Service supports OpenSearch and legacy Elasticsearch OSS. When you create a cluster, you have the option of which search engine to use. OpenSearch Service offers broad compatibility with Elasticsearch OSS 7.10, the final open source version of the software.
Note:- On September 8, 2021: Amazon Elasticsearch Service has been renamed to Amazon OpenSearch Service. Visit the website to learn more. This means that Elasticsearch and Kibana will no longer be open source software. Checkout official communication for the same here

Table Of Contents
- Prerequisite.
- Features of Amazon OpenSearch Service
- Create Amazon OpenSearch Service Cluster.
- Launch Windows EC2 To Access Amazon OpenSearch Service Cluster.
- Enable VPC Flow Logs In Cloudwatch.
- Create Subscription Filter To Stream Logs to OpenSearch Service.
- Create Index to Discover Cloudwatch Logs.
- Discover Logs Streamed From CloudWatch In Kibana.
- Create Custom Dashboard To Analyze and Visualize Logs In Kibana
Prerequisite
An AWS Account An IAM User with:
- AWS Management Console access to create AWS ElasticSearch Cluster and launch EC2 instances.
- The IAM permissions required to perform IAM, ElasticSearch , and CloudWatch activities. IAM policy creation and AWS Application Programming Interface (API) permissions are outside this article’s scope. Always adhere to the principle of least privilege when authorizing accounts to perform actions.
Features of Amazon OpenSearch Service
- Scale
- Security
- Stability
- Flexibility
- Integration with popular services
To have detailed information of its features please visit AWS official documentation here
Create Amazon OpenSearch Service Cluster.
- From AWS console select Amazon OpenSearch Service

- Click on create a new domain

- As part of our implementation we are going to choose deployment type as "Development and testing" and latest version and click next
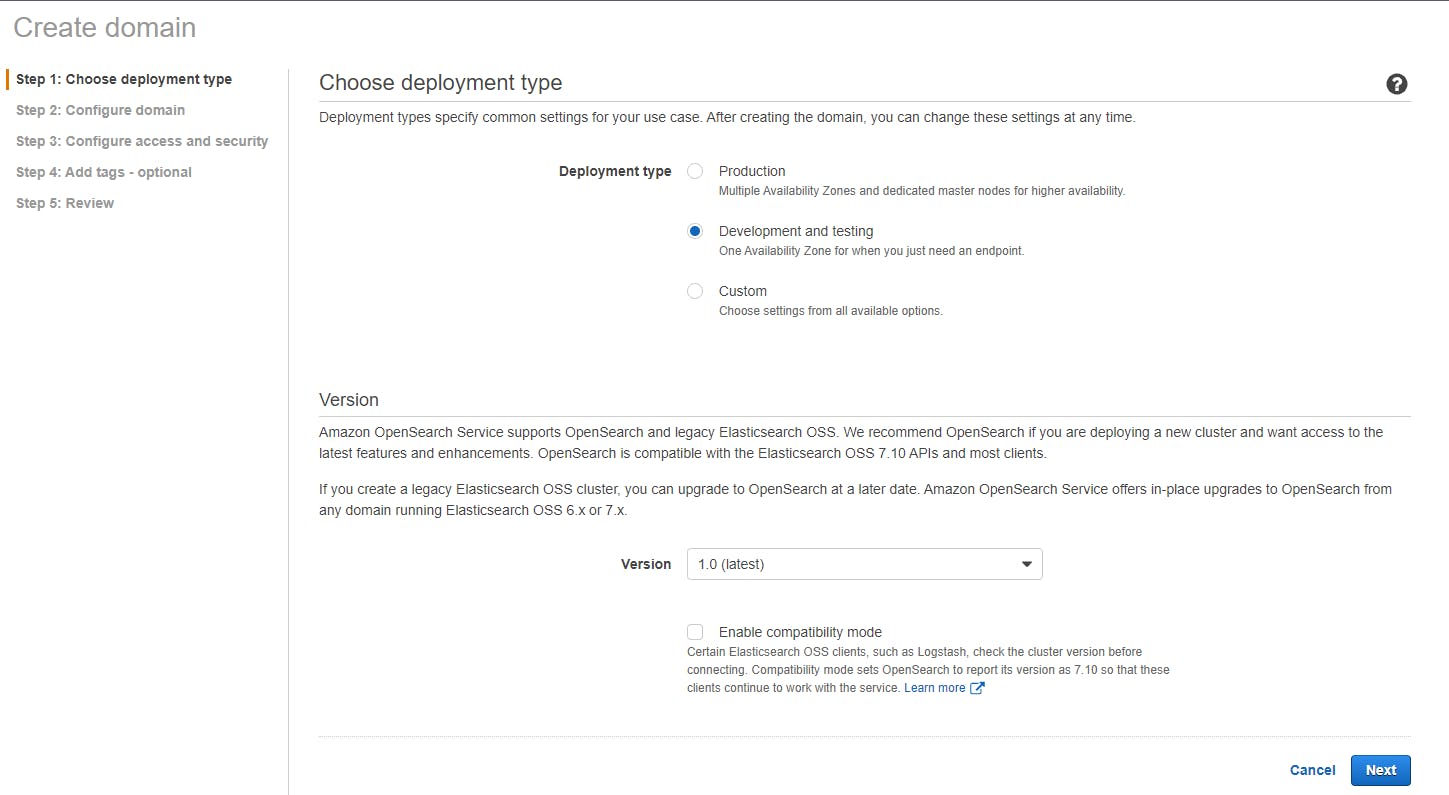
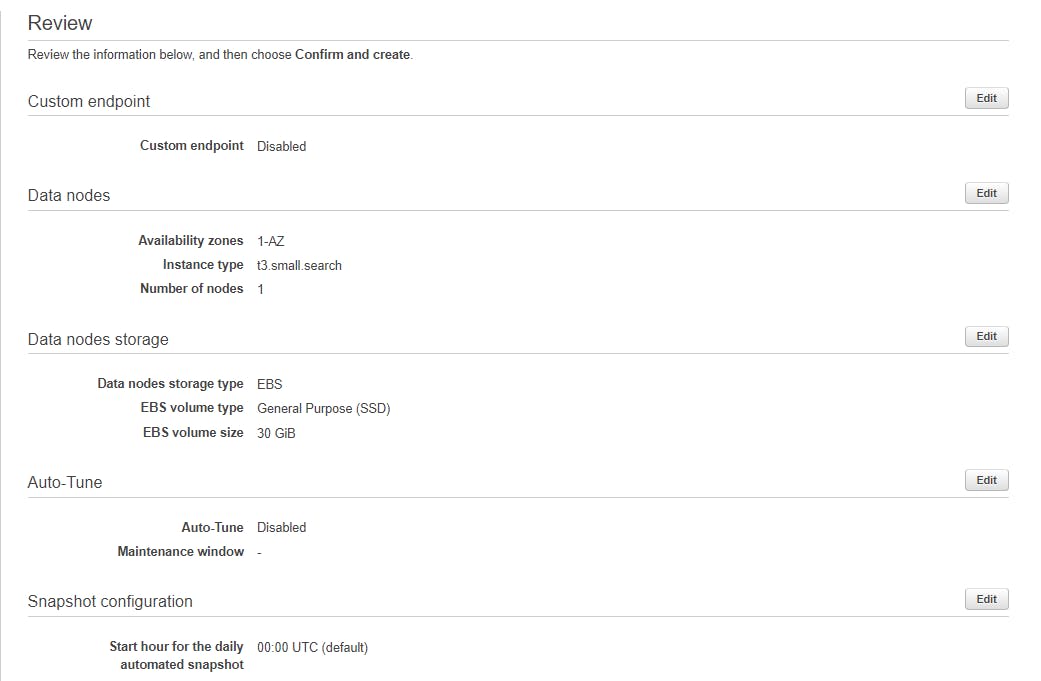
- A domain is the collection of resources needed to run Amazon OpenSearch Service. The domain name will be part of your domain endpoint. In configure domain we will define cluster name as "dc-test-cluster"

- Check or uncheck custom endpoint as per your requirement , Each Amazon OpenSearch Service domain has an auto-generated endpoint, but you can also define a custom endpoint for easy reference, and associate a certificate from AWS Certificate Manager (ACM). We are going to keep it as unchecked.

- Auto-Tune analyzes cluster performance over time and suggests optimizations based on your workload. You can choose to deploy these changes or roll back to the default Amazon OpenSearch Service settings at any time. We are going to disable "Auto-Tune".

- Select an instance type that corresponds to the compute, memory, and storage needs of your application. Consider the size of your indices, number of shards and replicas, type of queries, and volume of requests. We selected "t3.small.search" and number of nodes as 1.

- Choose a storage type for your data nodes. If you choose the EBS storage type, multiply the EBS storage size per node by the number of data nodes in your cluster to calculate the total storage available to your cluster. Storage settings do not apply to any dedicated master nodes in the cluster.

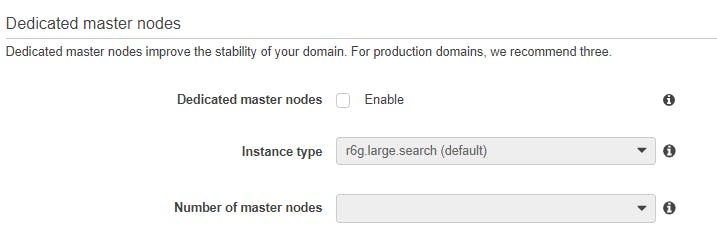
- Dedicated master nodes improve the stability of your domain. For production domains, we recommend three. As we are using for test purpose we have not enabled it.
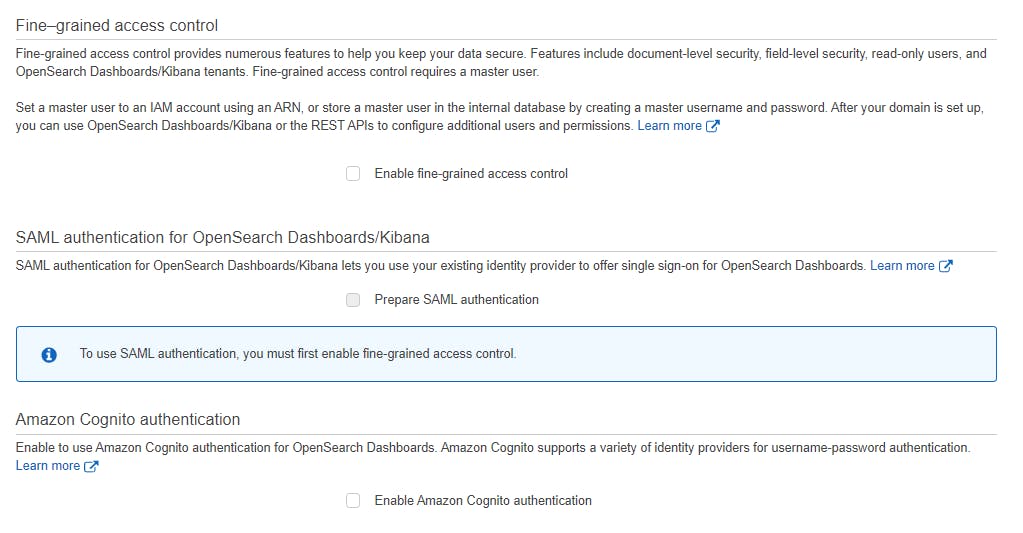
- Configure access and security:- Amazon OpenSearch Service offers numerous security features, including fine-grained access control, IAM, SAML, Cognito authentication for OpenSearch Dashboards/Kibana, encryption, and VPC access.
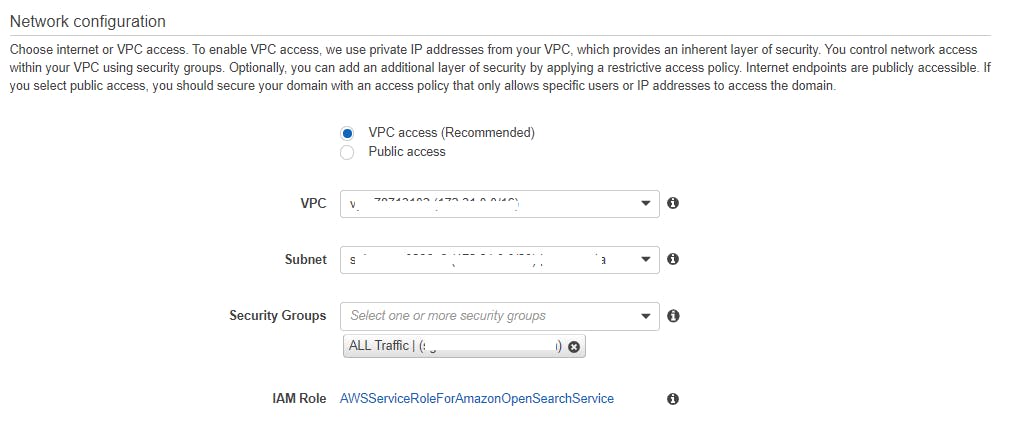
- Choose internet or VPC access. To enable VPC access, we use private IP addresses from your VPC, which provides an inherent layer of security. You control network access within your VPC using security groups. Optionally, you can add an additional layer of security by applying a restrictive access policy. Internet endpoints are publicly accessible. If you select public access, you should secure your domain with an access policy that only allows specific users or IP addresses to access the domain. For test purpose we have selected below settings
- Fine-grained access control provides numerous features to help you keep your data secure. Features include document-level security, field-level security, read-only users, and OpenSearch Dashboards/Kibana tenants. Fine-grained access control requires a master user and SAML authentication for OpenSearch Dashboards/Kibana lets you use your existing identity provider to offer single sign-on for OpenSearch Dashboards and Amazon Cognito authentication for OpenSearch Dashboards. Amazon Cognito supports a variety of identity providers for username-password authentication.. We have kept all three disabled.
- Access policies control whether a request is accepted or rejected when it reaches the Amazon OpenSearch Service domain. If you specify an account, user, or role in this policy, you must sign your requests. For this handson we will keep open access to domain.

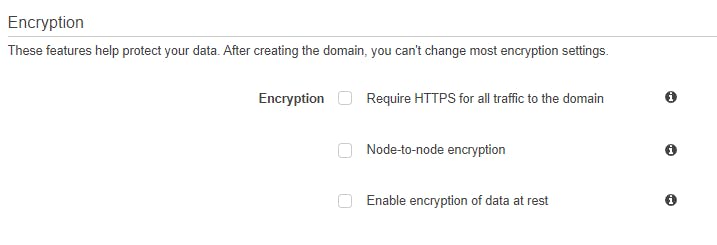
- These features help protect your data. After creating the domain, you can't change most encryption settings. We keep all disabled.
- You can add tags to describe your domain. A tag consists of a case-sensitive key-value pair. For example, you can define a tag with a key-value pair of Environment Name-Development. You can create up to 50 tags for each domain.

- Now review your configuration and click on create.
- After clicking on create your cluster creation will be initiated and you will get below page. You cannot load data or run queries against your domain until the initialization is complete. The domain status will change to Active as soon as your domain is ready to use.
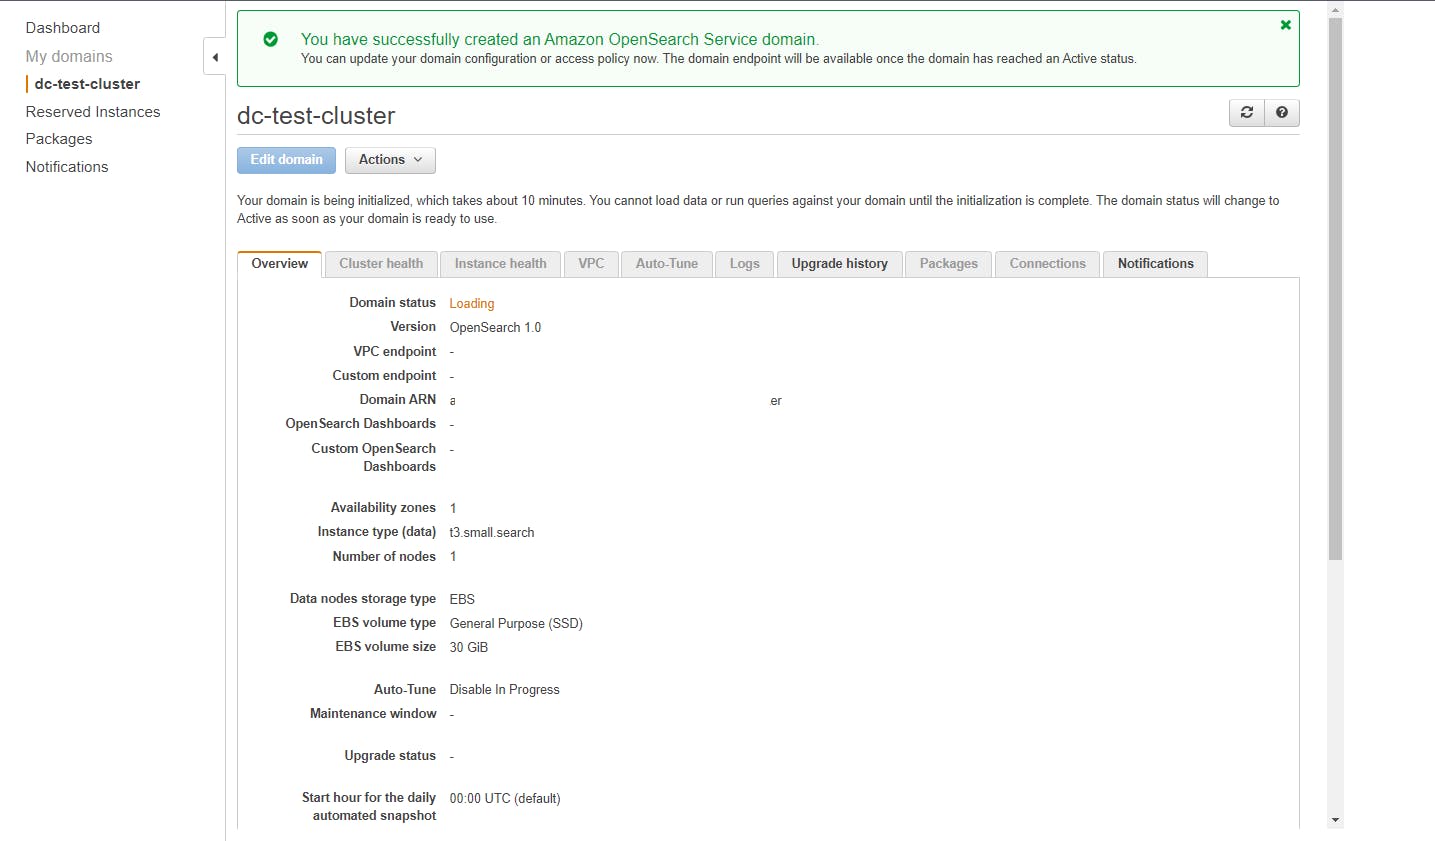
- Once it is completed domain status will change to "Active". "VPC Endpoint" and "OpenSearch Dashboards" links will be available for you.
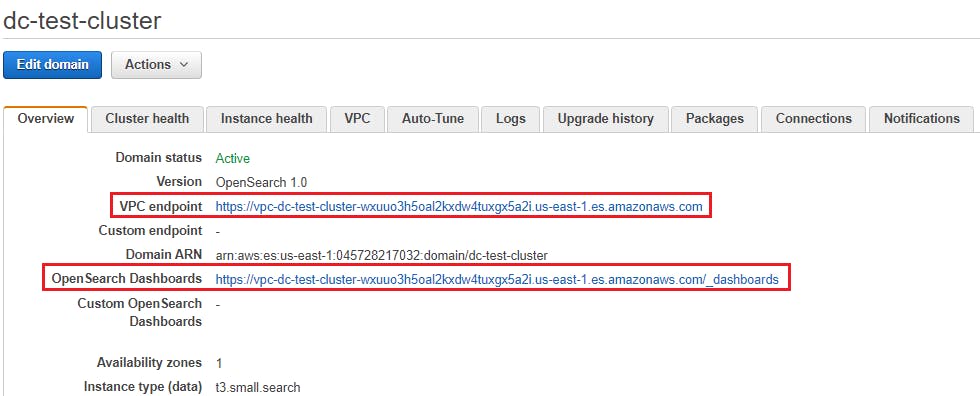
- It will also populate data for all below tabs.
 Now to login to this cluster to see if it is up and running we will have to login via instance which is created in same subnet where cluster is created.
To create cluster with public access refer below video.
Launch Windows EC2 To Access ElasticSearch Cluster In Same Subnet.
- We will install Windows EC2 by using below python script.
import boto3 client = boto3.client('ec2') resp=client.run_instances(ImageId='ami-0ba6d33ccf9c1d893', InstanceType='t2.micro', MinCount=1, MaxCount=1, KeyName='<Your Key Name>', Placement={'AvailabilityZone': '<AZ where cluster is created>'}, TagSpecifications=[ { 'ResourceType': 'instance', 'Tags': [{'Key': 'Name','Value': 'Windows Server'},] }, ], ) - Once EC2 is launched Goto security group and allow RDP port 3389.
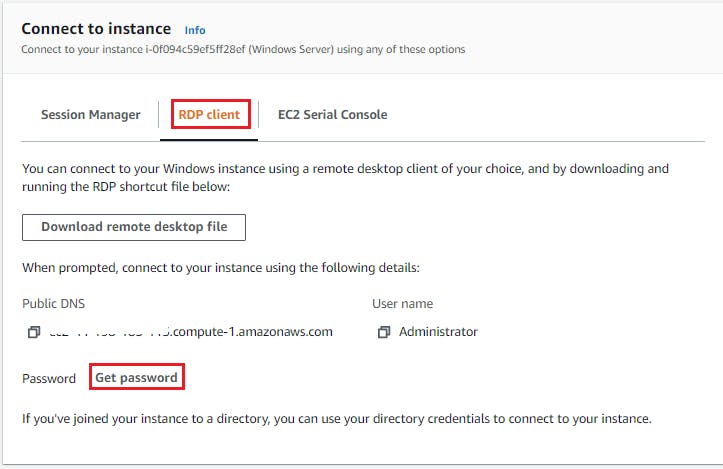
- Once EC2 is launched and in running state select your launched EC2 and click on "Connect".

- Once you click on connect you will get below window where you need to select "RDP Client" and then click on "Get password".
- When you click on "Get password" it will ask for your key file which is attached to this instance.
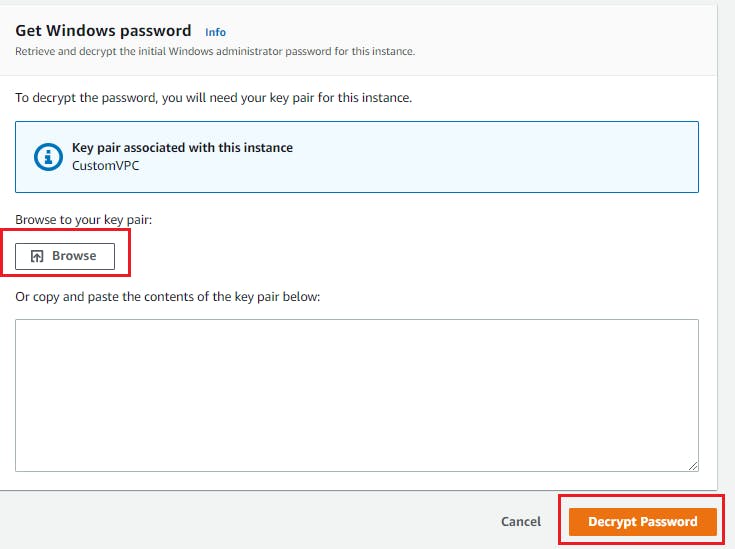
- Store this password at some place as you will require this to RDP your EC2 Windows instance.
- Lets RDP to the windows EC2 instance. It will prompt to provide password which we have fetched in last step.
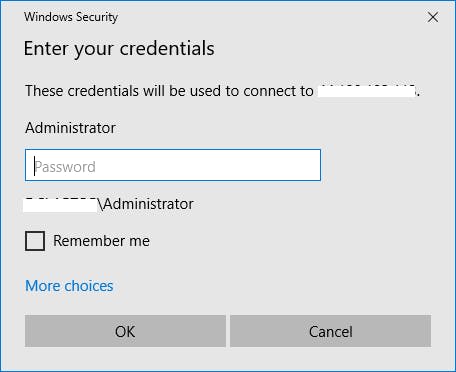
- After logging to windows server first install google chrome.
- While installing chrome I encountered below error. If you din't please skip this part.
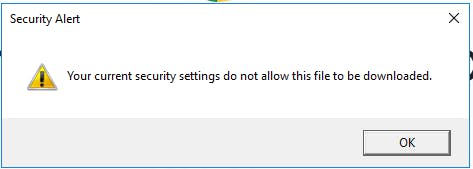
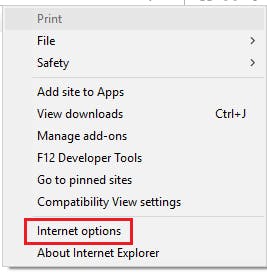
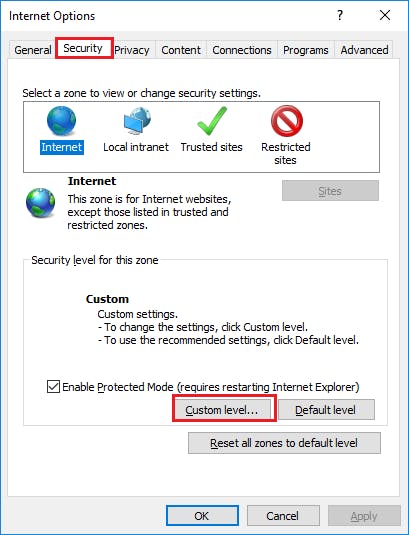
- To resolve this error Click on Tools -> Internet Options -> Security tab -> Custom level.
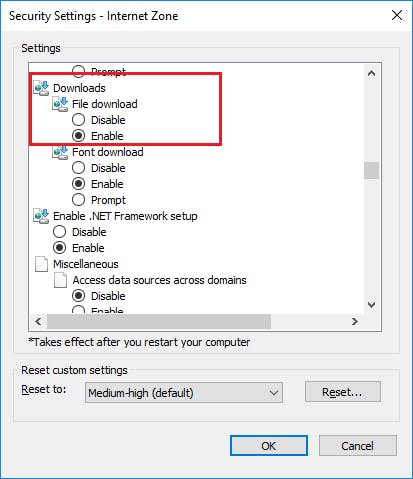
- Look for the Downloads section > Under the File download option select Enable
- Once chrome is downloaded successfully use the "OpenSearch Dashboard" link from your cluster to login and you will see this page

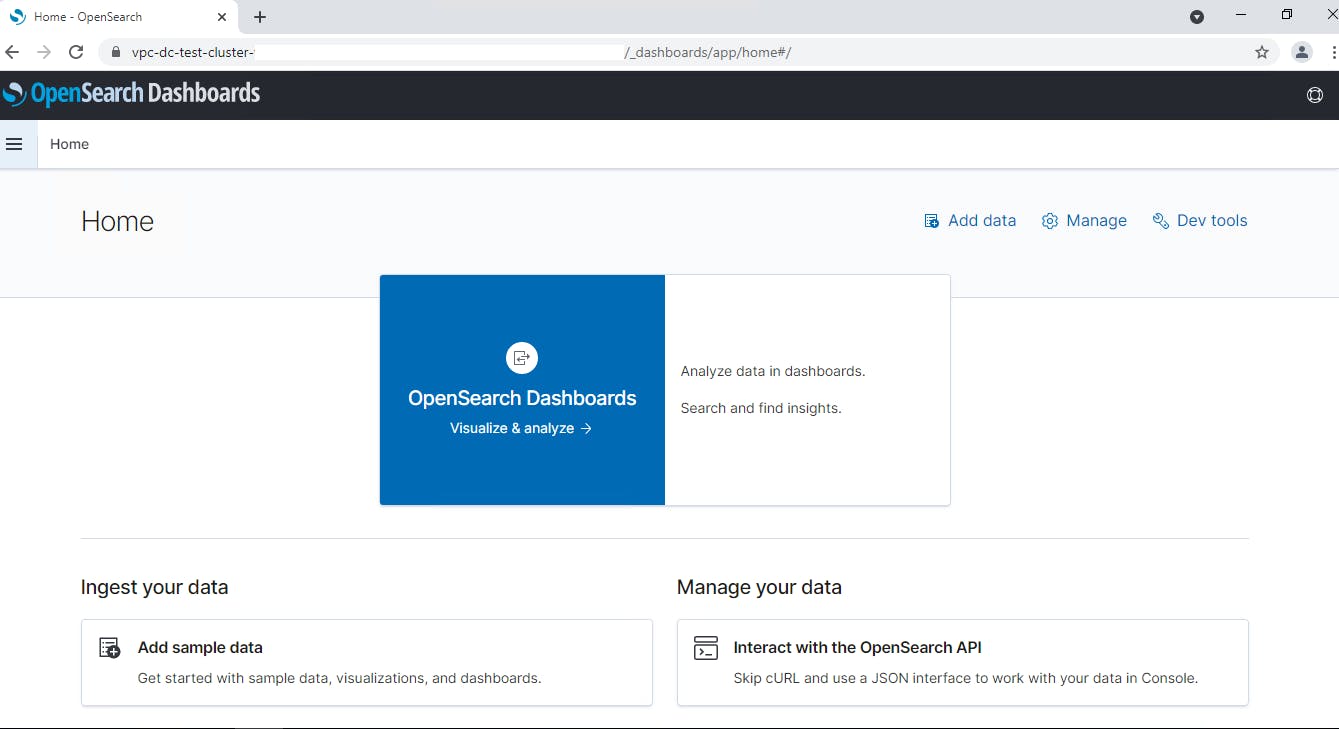 Now as our cluster is ready we will integrate our cloudwatch logs to Amazon Open Source. To do that lets first enable VPC Flow Log In Cloudwatch.
Enable VPC Flow Logs In Cloudwatch.
- The IAM role that's associated with your flow log must have sufficient permissions to publish flow logs to the specified log group in CloudWatch Logs. The IAM role must belong to your AWS account.
- To Create IAM rule open IAM service on AWS Console and select roles. Create Roles
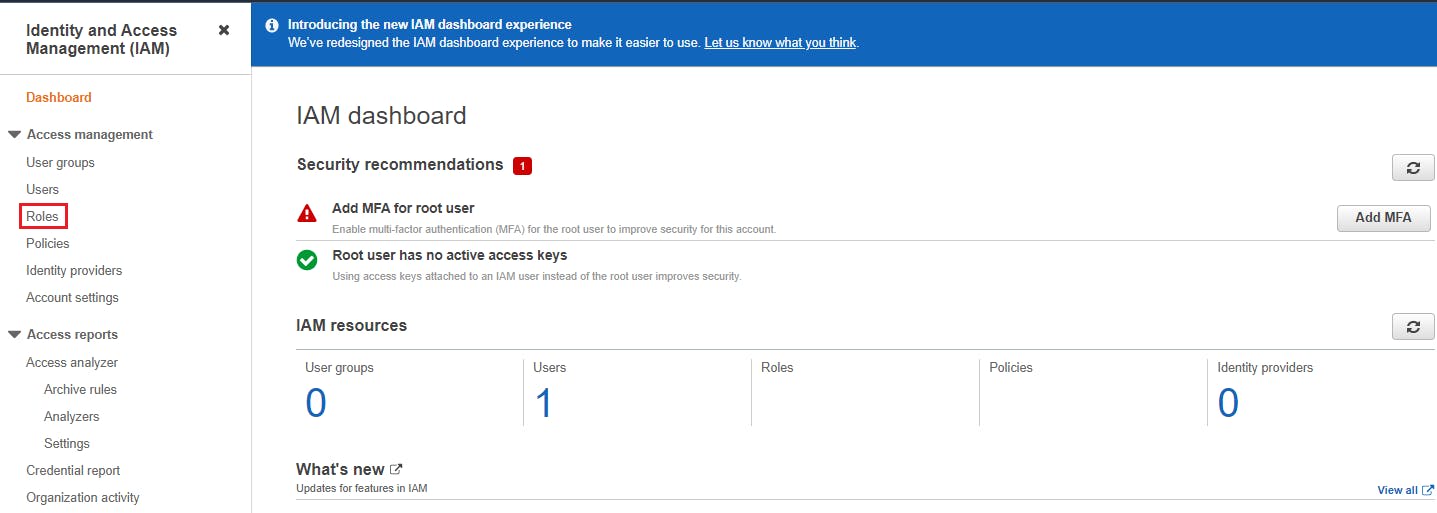
- For Select type of trusted entity, choose AWS service. For Use case, choose EC2. Choose Next: Permissions
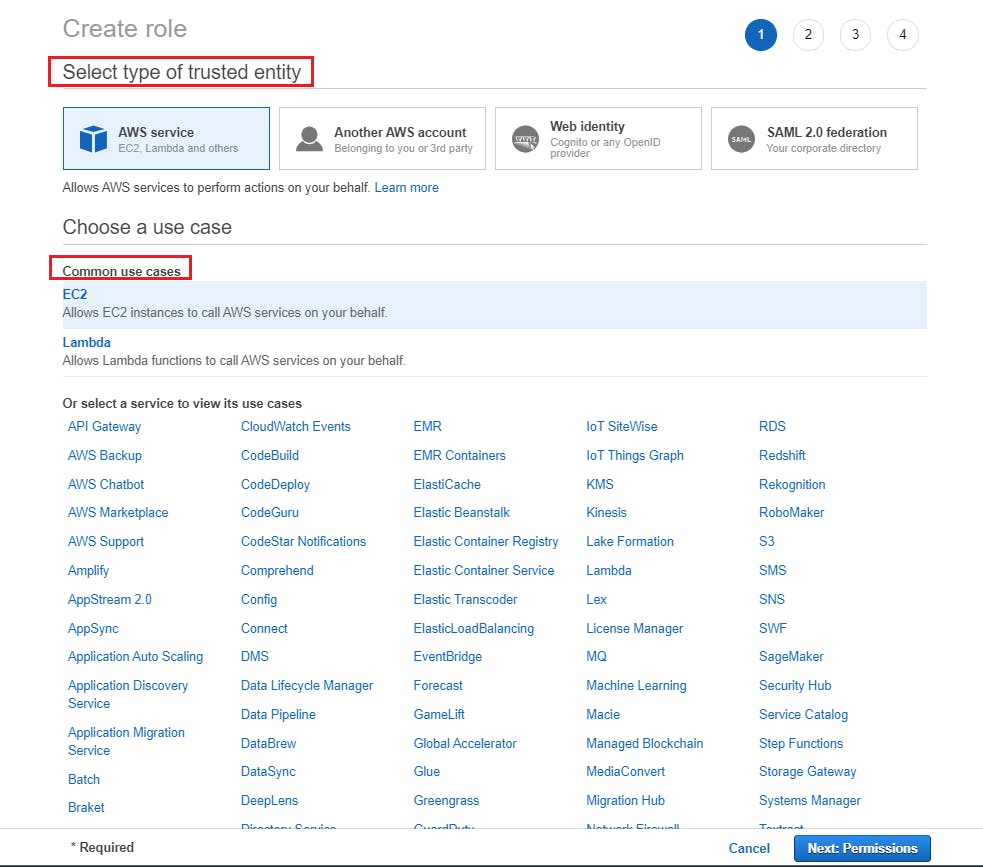
- On the Attach permissions policies page, choose Next: Tags and optionally add tags. Choose Next: Review.
- Enter a name for your role and optionally provide a description. Choose Create role.
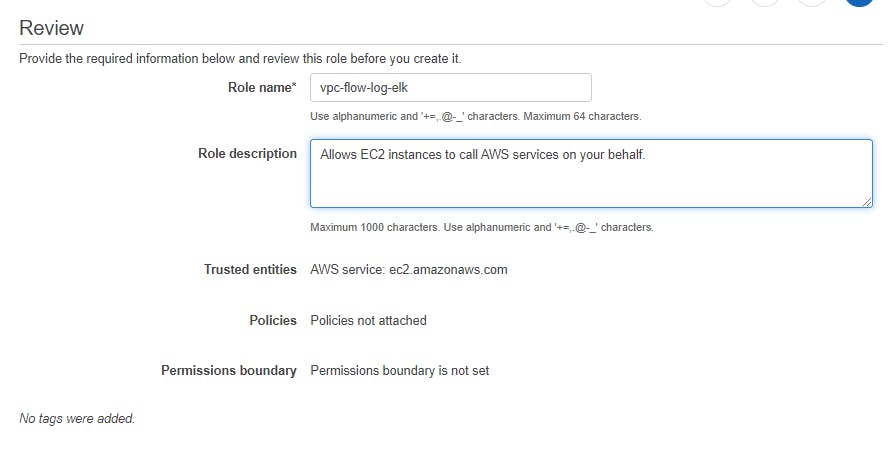
- Select the name of your role. For Permissions, choose Add inline policy.

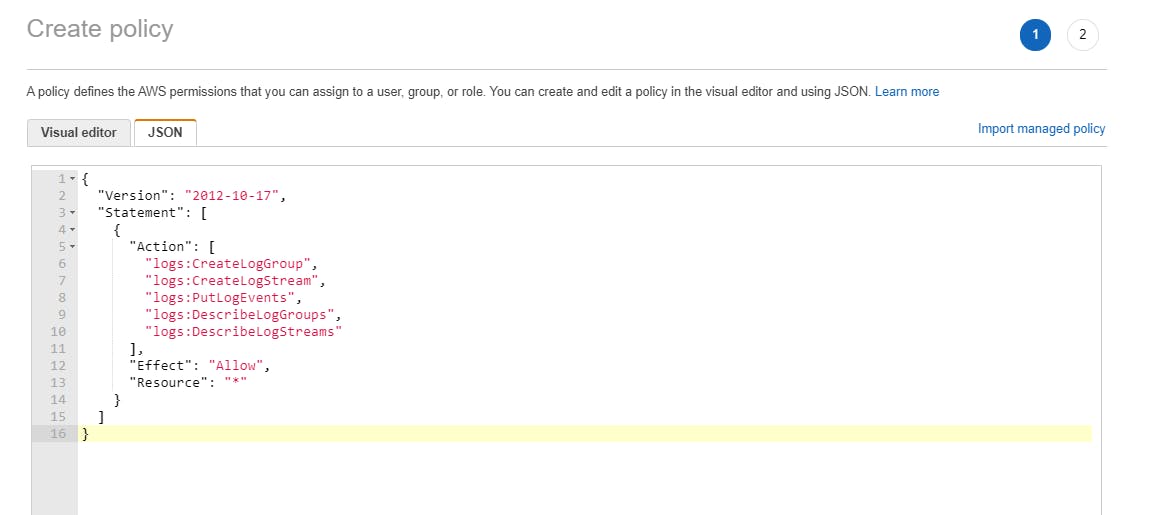
- In the window opened select JSON tab and paste below policy over there.
{
"Version": "2012-10-17",
"Statement": [
 {
   "Action": [
     "logs:CreateLogGroup",
     "logs:CreateLogStream",
     "logs:PutLogEvents",
     "logs:DescribeLogGroups",
     "logs:DescribeLogStreams"
   ],
   "Effect": "Allow",
   "Resource": "*"
 }
]
}
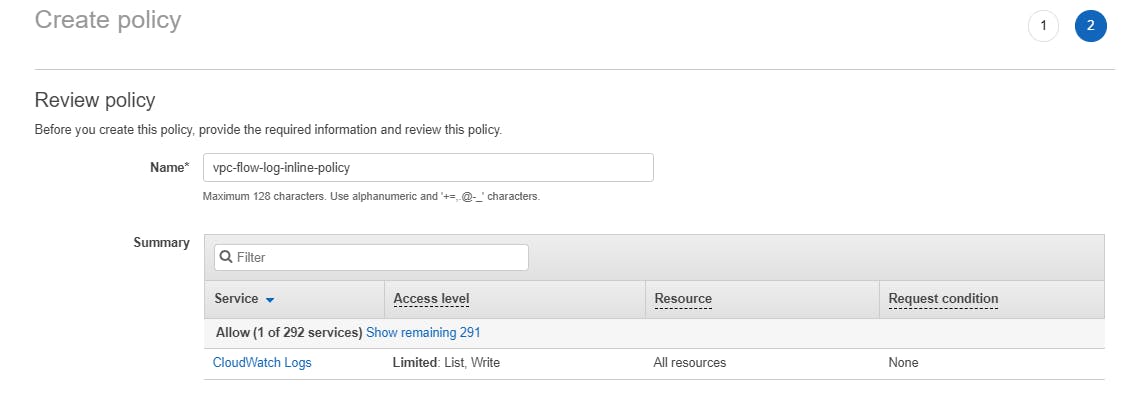
- Enter a name for your policy, and choose Create policy.
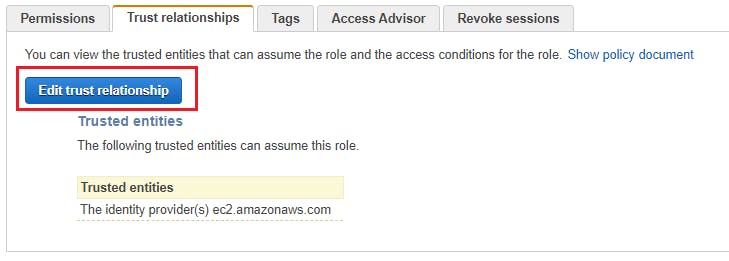
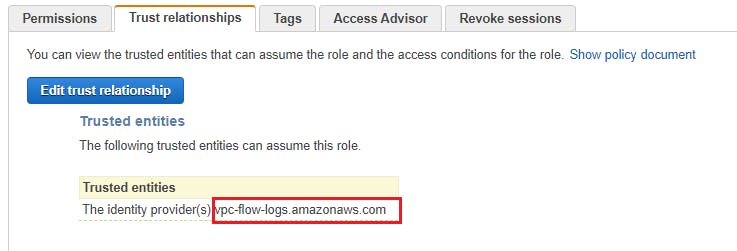
- For Trust relationships, choose Edit trust relationship. In the existing policy document, change the service from ec2.amazonaws.com to vpc-flow-logs.amazonaws.com. Choose Update Trust Policy.
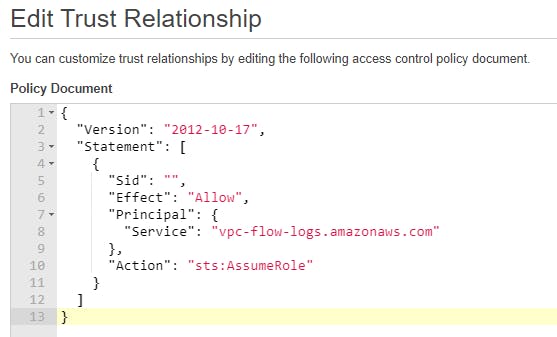
"Version": "2012-10-17",
"Statement": [
 {
   "Sid": "",
   "Effect": "Allow",
   "Principal": {
     "Service": "vpc-flow-logs.amazonaws.com"
   },
   "Action": "sts:AssumeRole"
 }
]
}
- On the Summary page, note the ARN for your role. You need this ARN when you create your flow log.
- Now goto cloudwatch and create log group

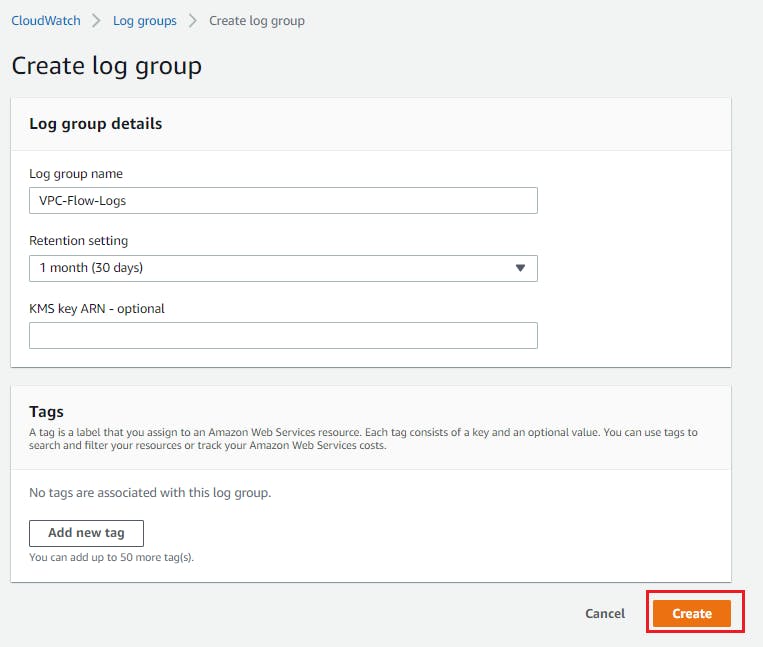
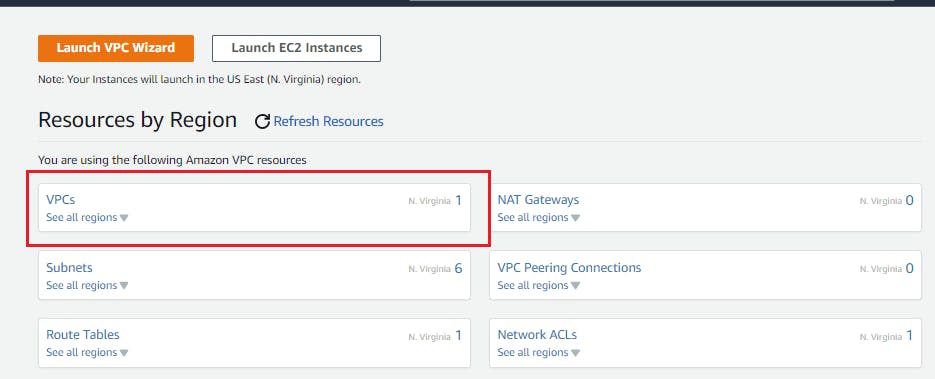
- Search for VPC in AWS console and open it.

- Open you VPC for which you want to enable flow logs
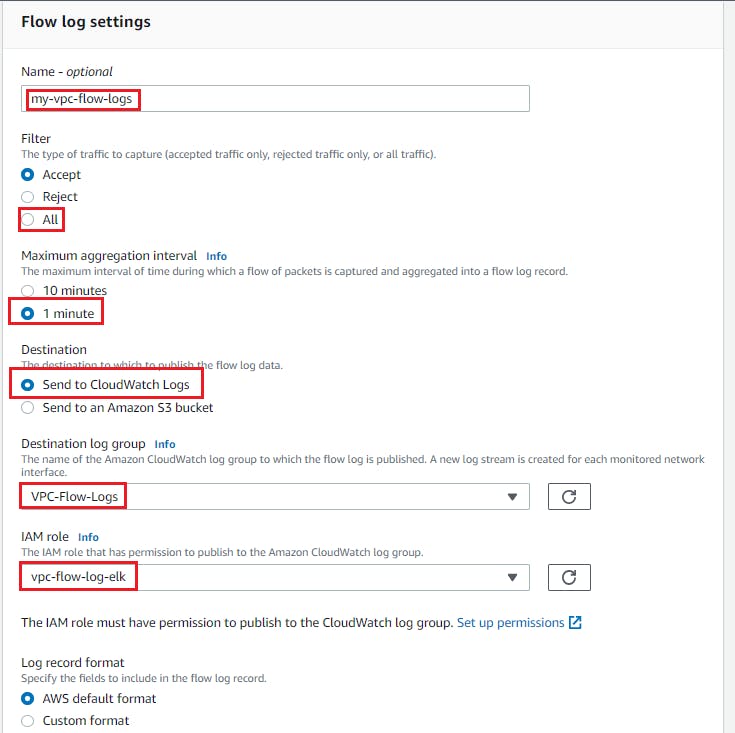
- Once you select you VPC you will see option to create flow log as below
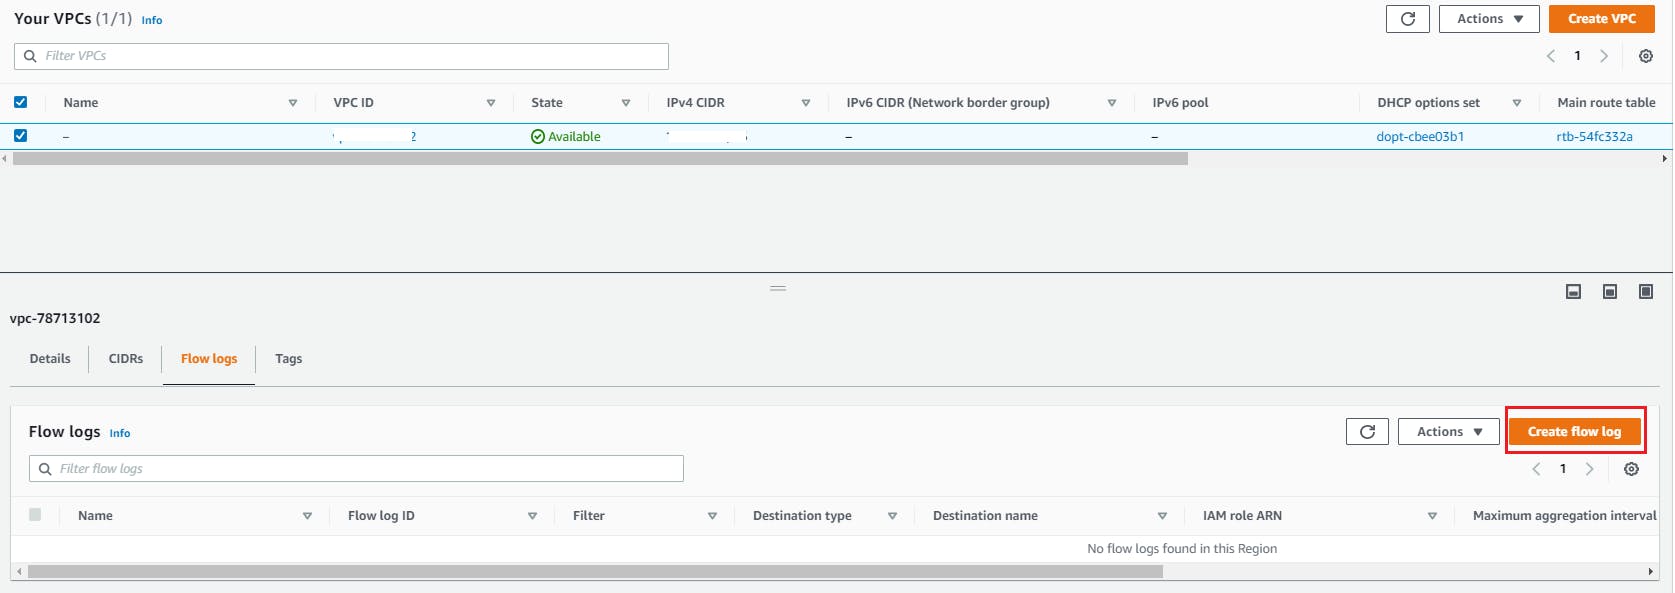
- Configure flow logs as per below screenshot. Select the log group name that we have created above and IAM role that we created above.
Create Subscription Filter To Stream Logs to Amazon OpenSearch.
- Create a role with AWS Service trusted entity and lambda use case.
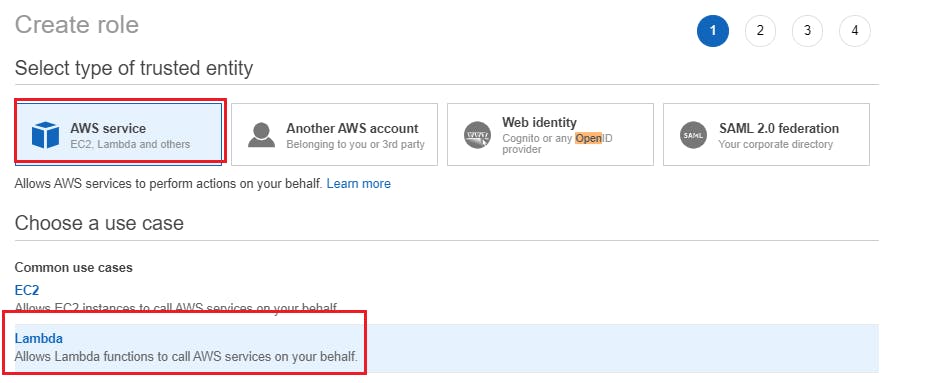
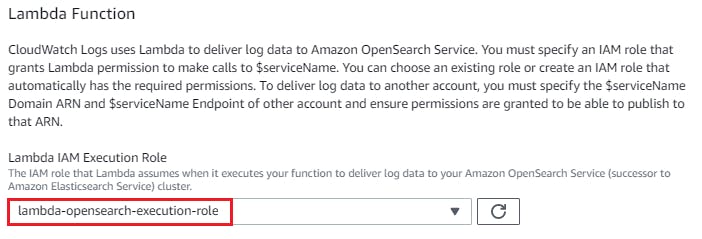
- Attach "AmazonOpenSearchServiceFullAccess" and "AWSLambdaVPCAccessExecutionRole" policy and create role with name "lambda-opensearch-execution-role".
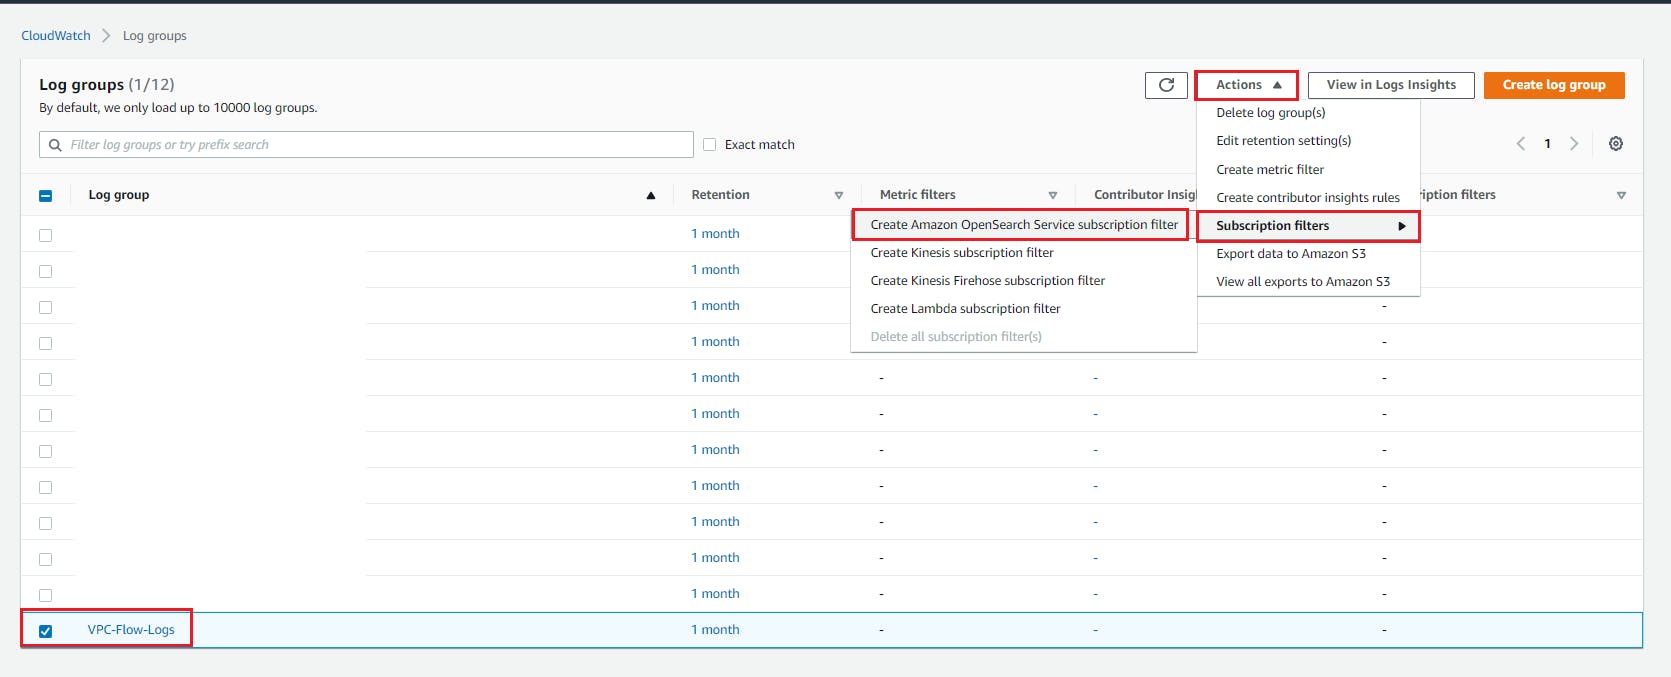
- Select the "VPC-Flow-Logs" log group > Actions > Subscription filters > Create Amazon OpenSearch Service subscription filter
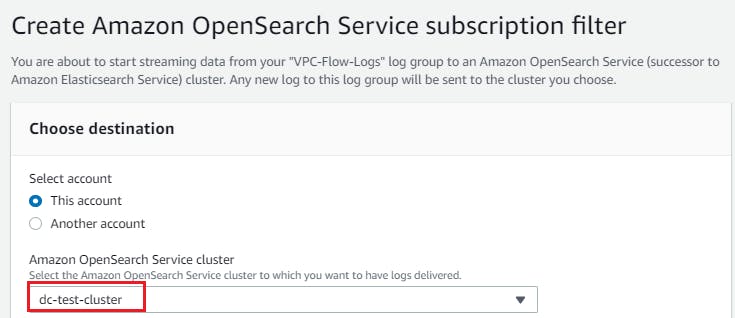
- Choose destination cluster as the OpenSearch cluster we created earlier "dc-test-cluster".
- Choose Lambda role we create above.
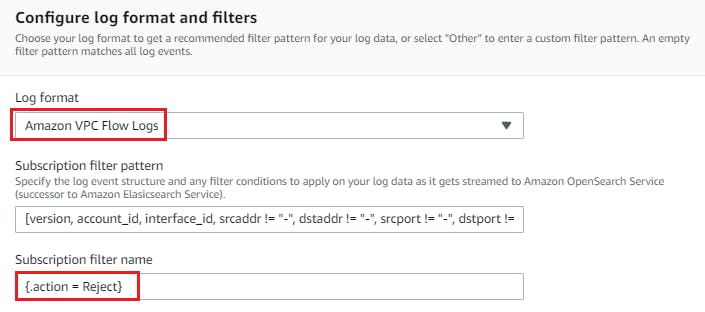
- Choose your log format to get a recommended filter pattern for your log data, or select "Other" to enter a custom filter pattern. An empty filter pattern matches all log events.
- Start Streaming and it will show status of subcription filter as below

- Once streaming is completed you will get below message on top of your screen.
 As Streaming of logs is completed lets go back to our cluster and check.
Create Index to Discover Cloudwatch Logs.
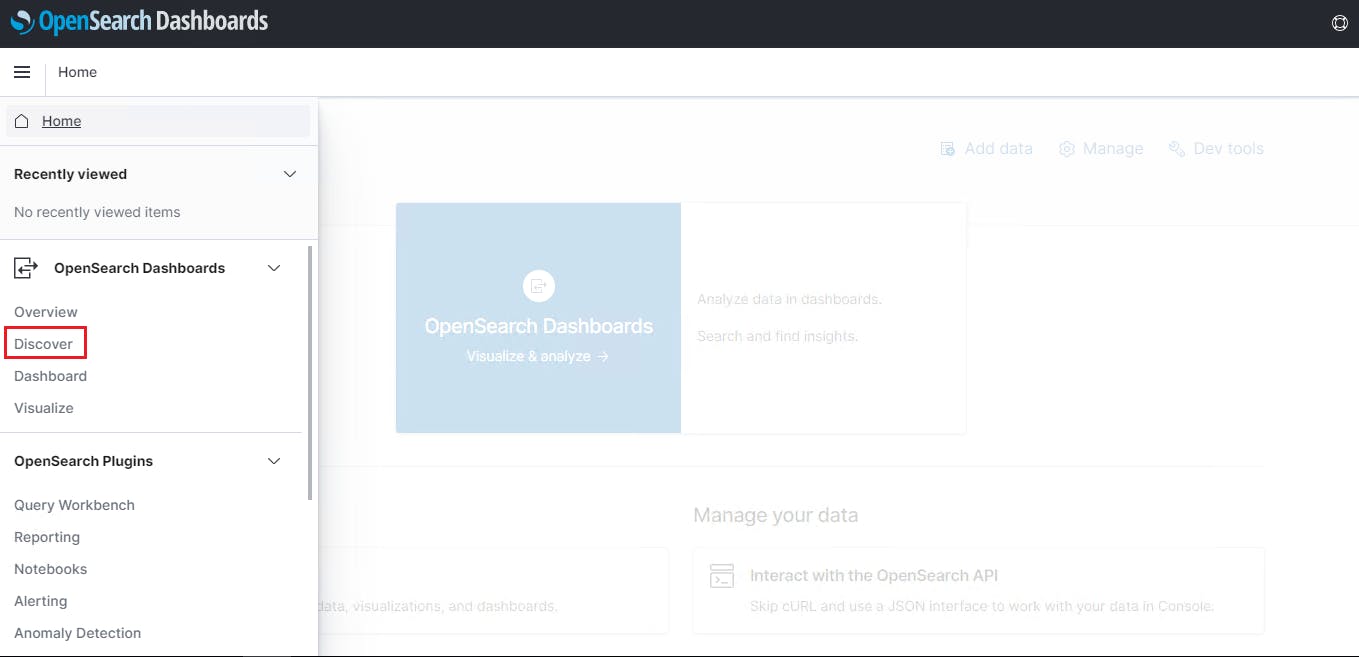
- Goto OpenSearch Dashboard and click on "Discover".
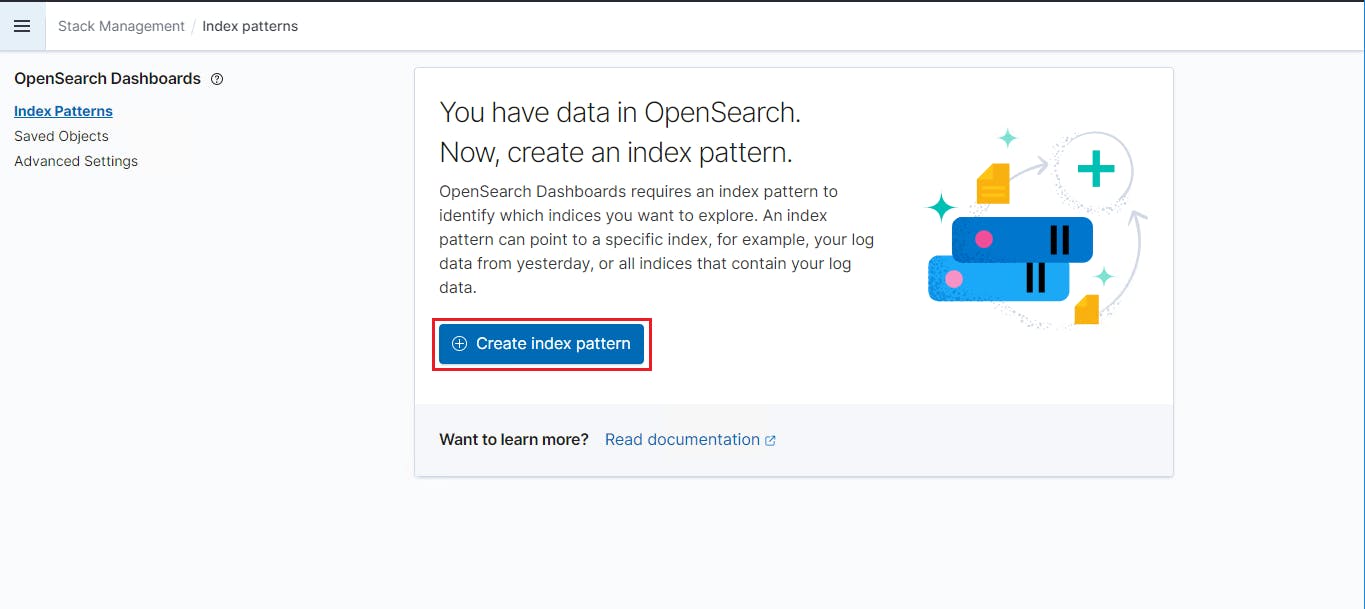
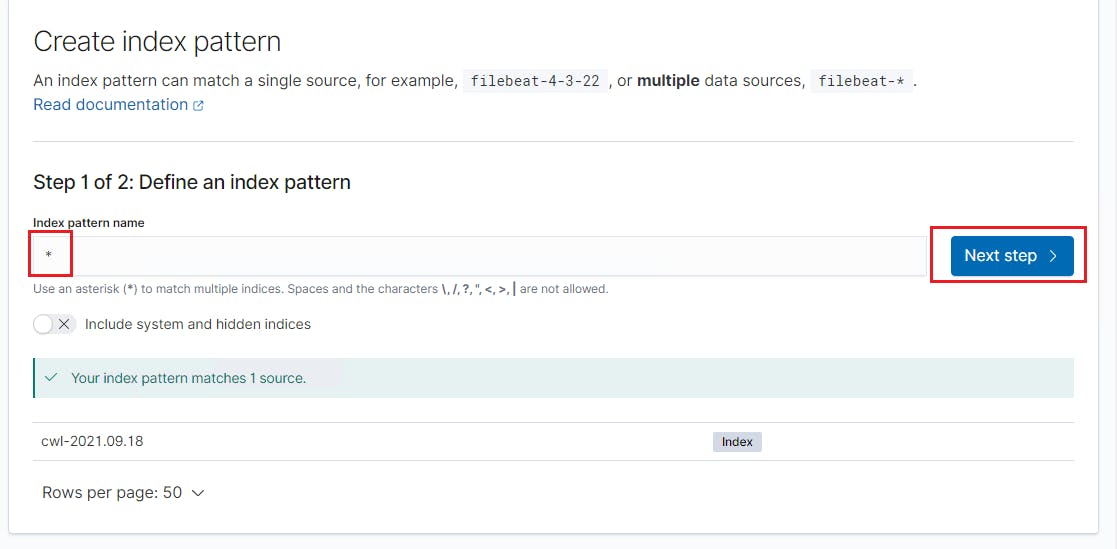
- It will prompt you to create index pattern. Click on "Create Index Pattern"
- Configure index pattern name as "*" and click "Next Step"
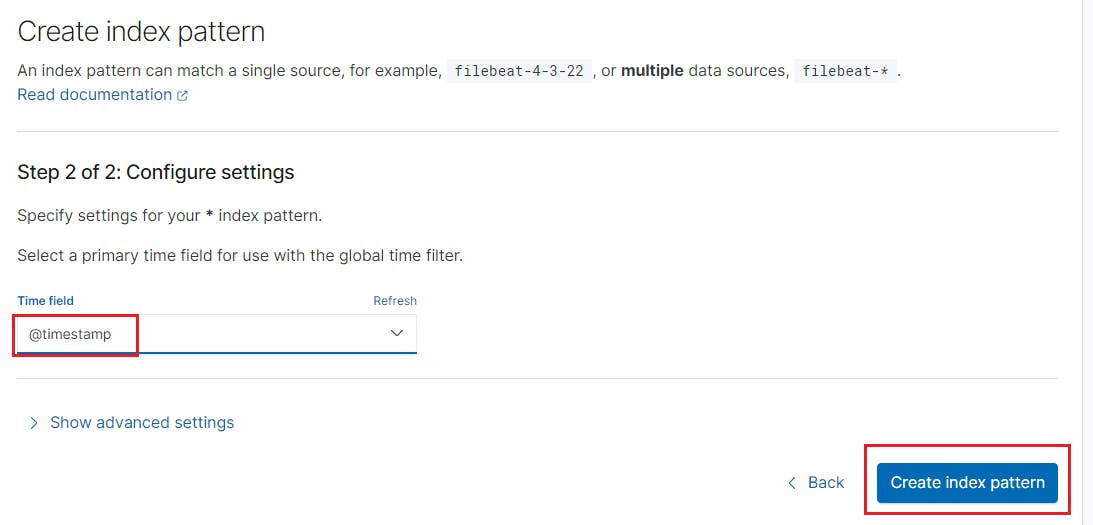
- Select time field as "@timestamp" and create index pattern.
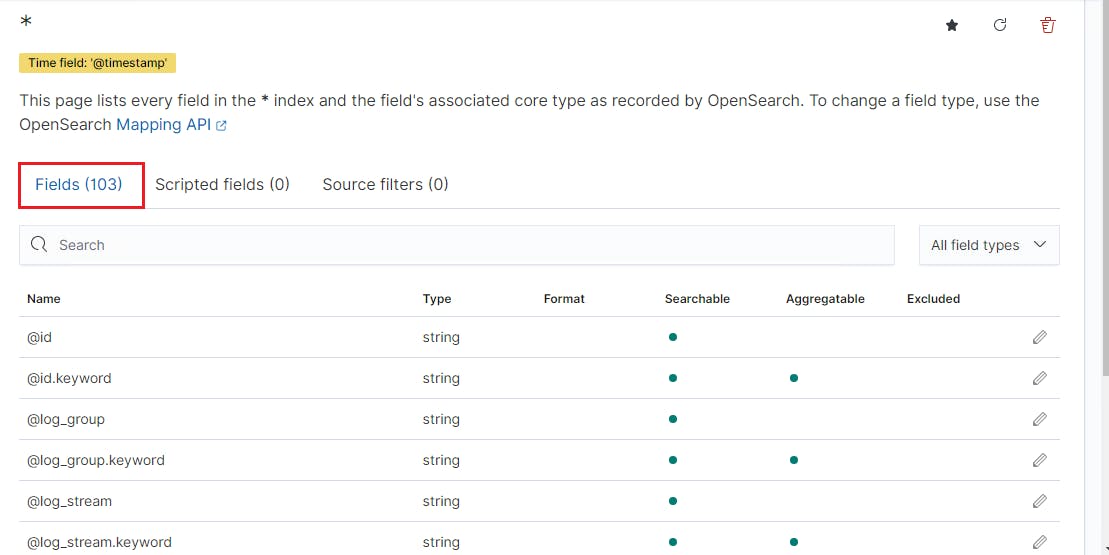
- As soon as we created index you can see it shows you list of fields.
- Now Lets goto Discover again and you can see our VPC flow logs is streamed successfully.
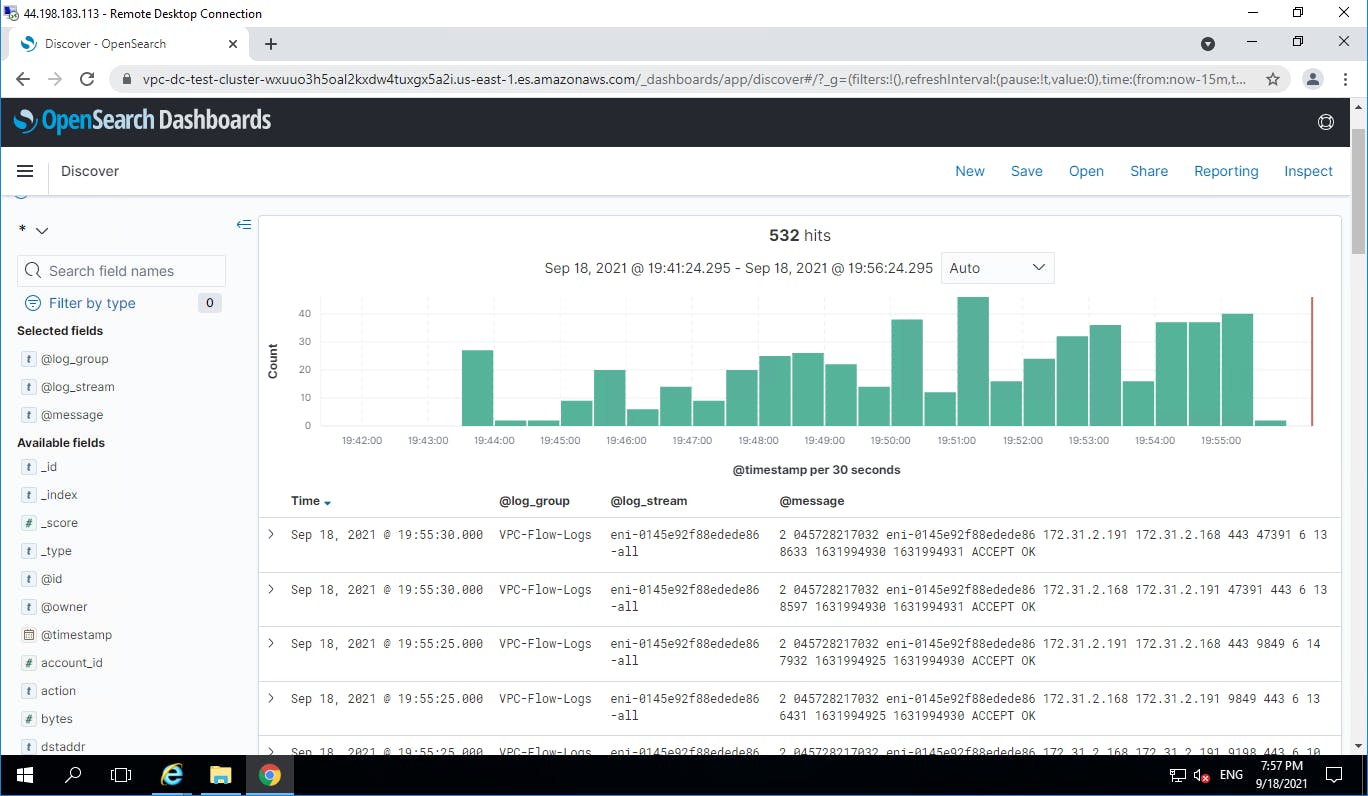
Discover Logs Streamed From CloudWatch In Kibana.
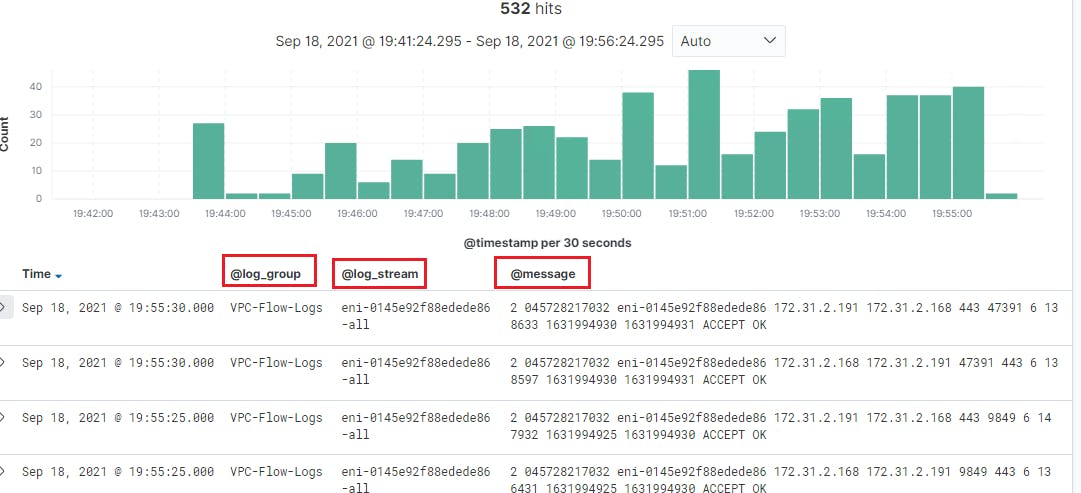
- In this discovered logs you can add columns why viewing it. For example you can see below only two logs column visible.
- On left side under "Available fields" you can select the fields which you want to add as column.
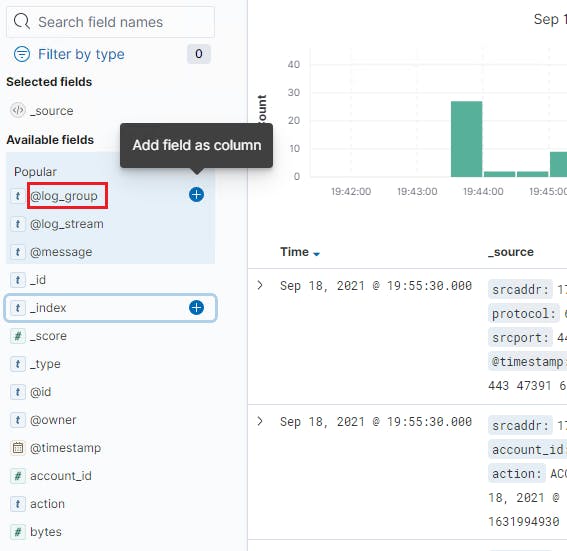
- Now lets add loggroup,logstream,message fields as columns
- If you want to perform DQL[Dashboard Query Language] you can do it as follows.
Lets search for "Accept" keyword from message column from the logs.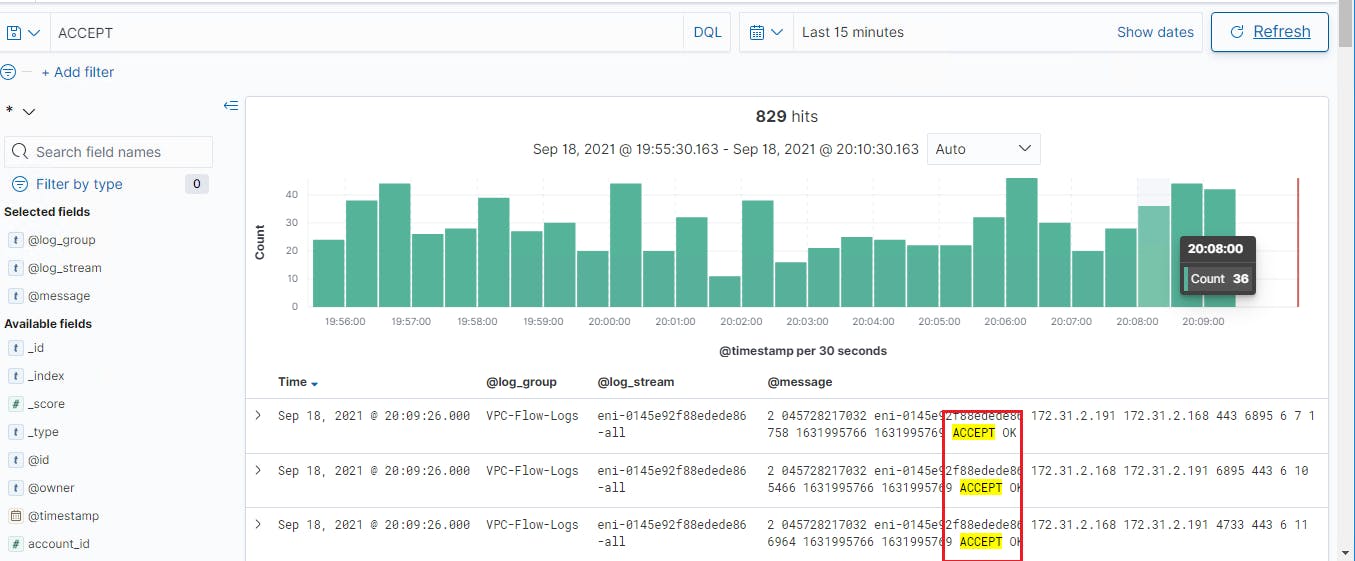
- To view logs based on your timestamp you can use out of the box functionality.
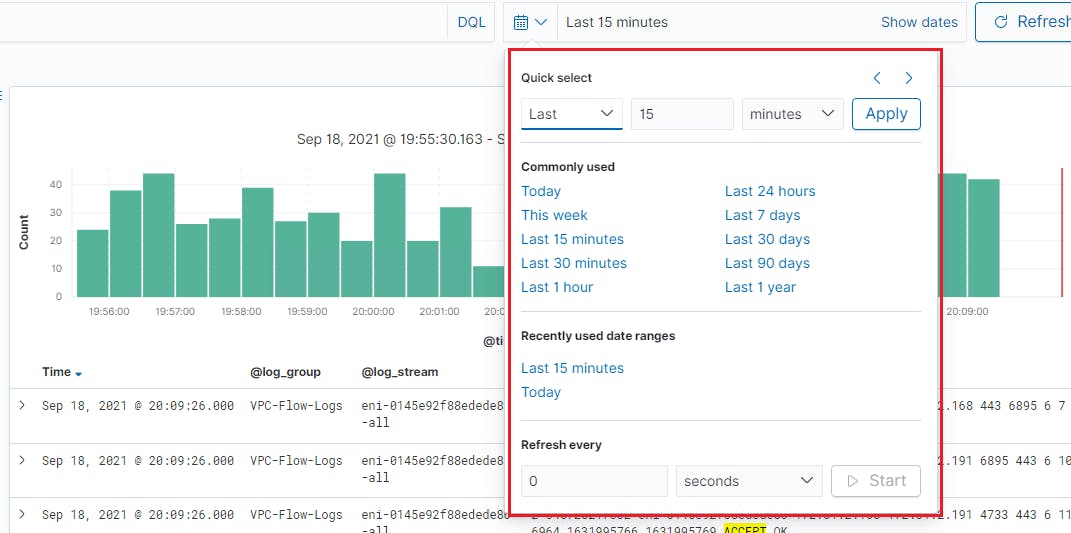
- To save you discovered search by adding your columns click on save.
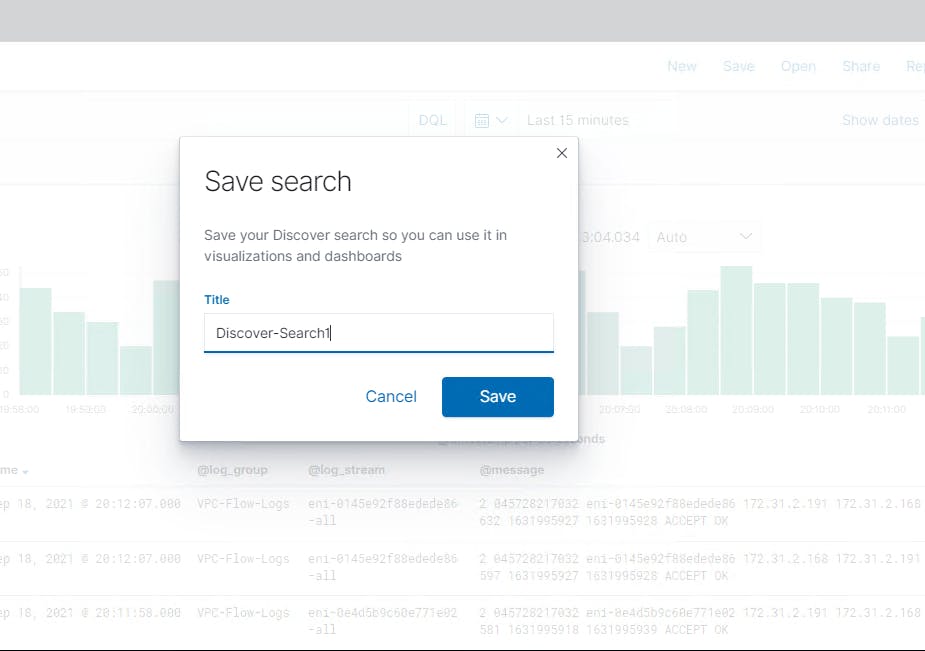
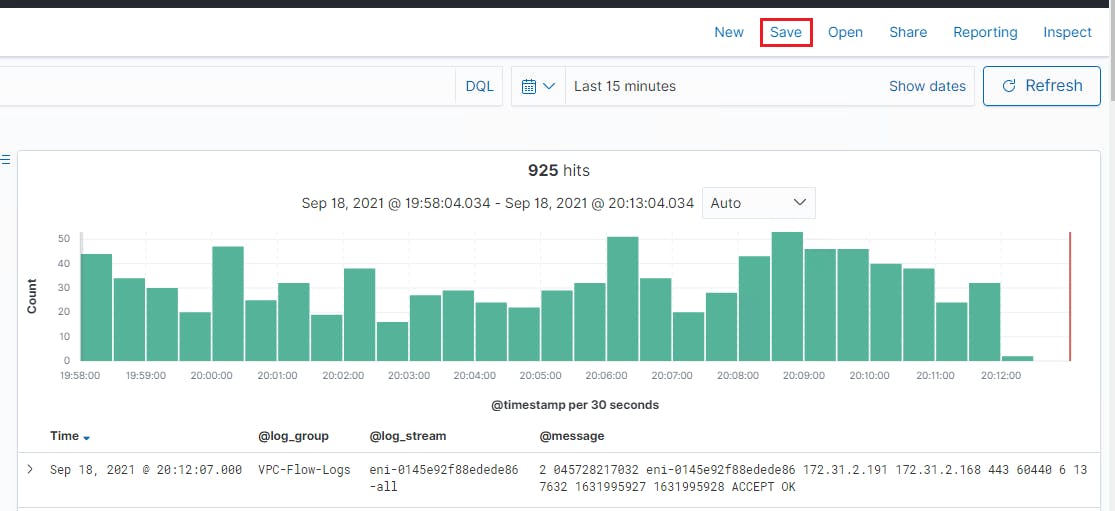 When you click on save it will prompt to add title for you search.
Create Custom Dashboard To Analyze and Visualize Logs In Kibana
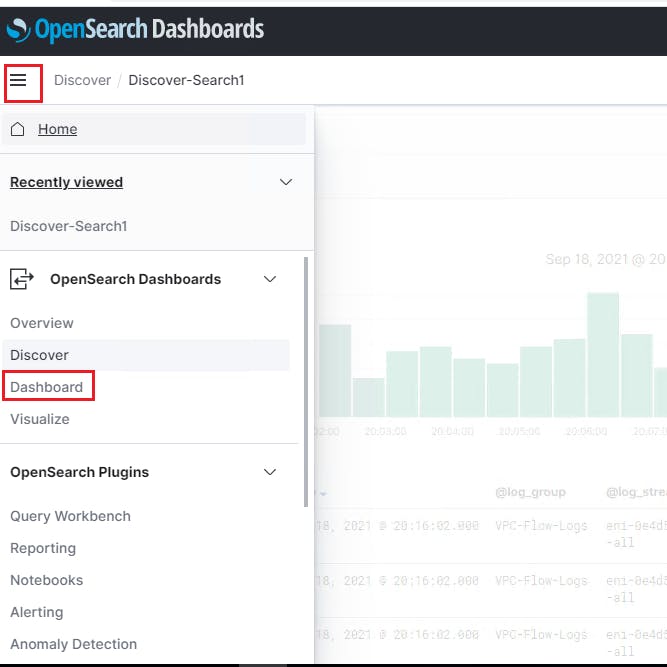
- To create dashboard goto Dashboard from left menu
- Create new dashboard
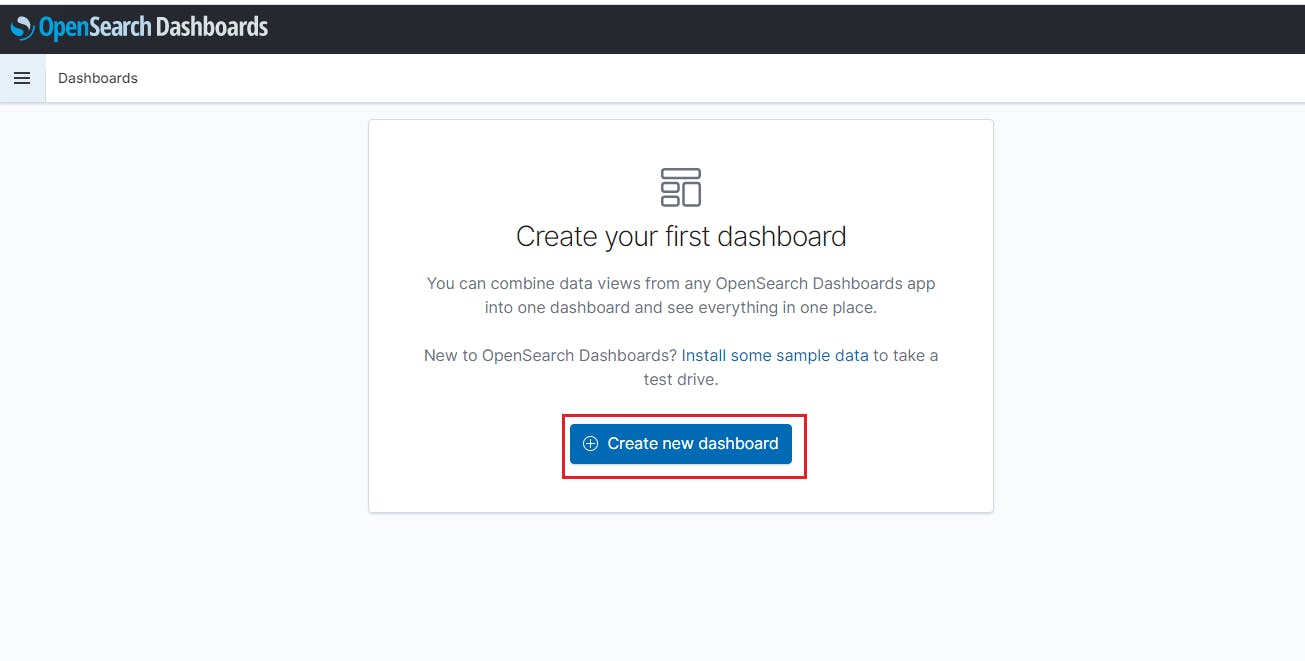
- Now lets add our previously saved search in this dashboard. Click on add existing and select it.
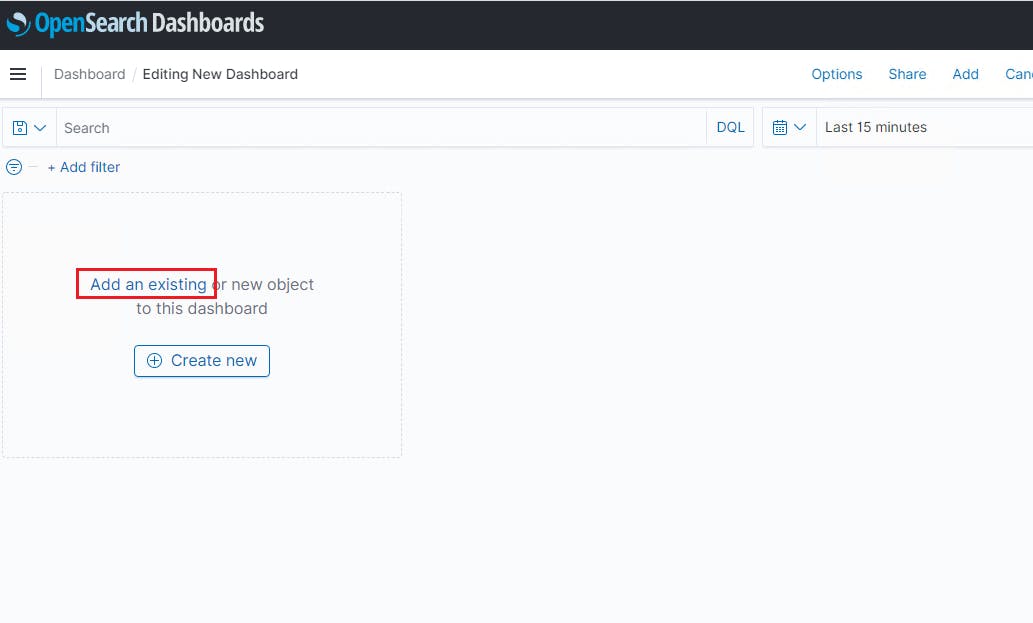

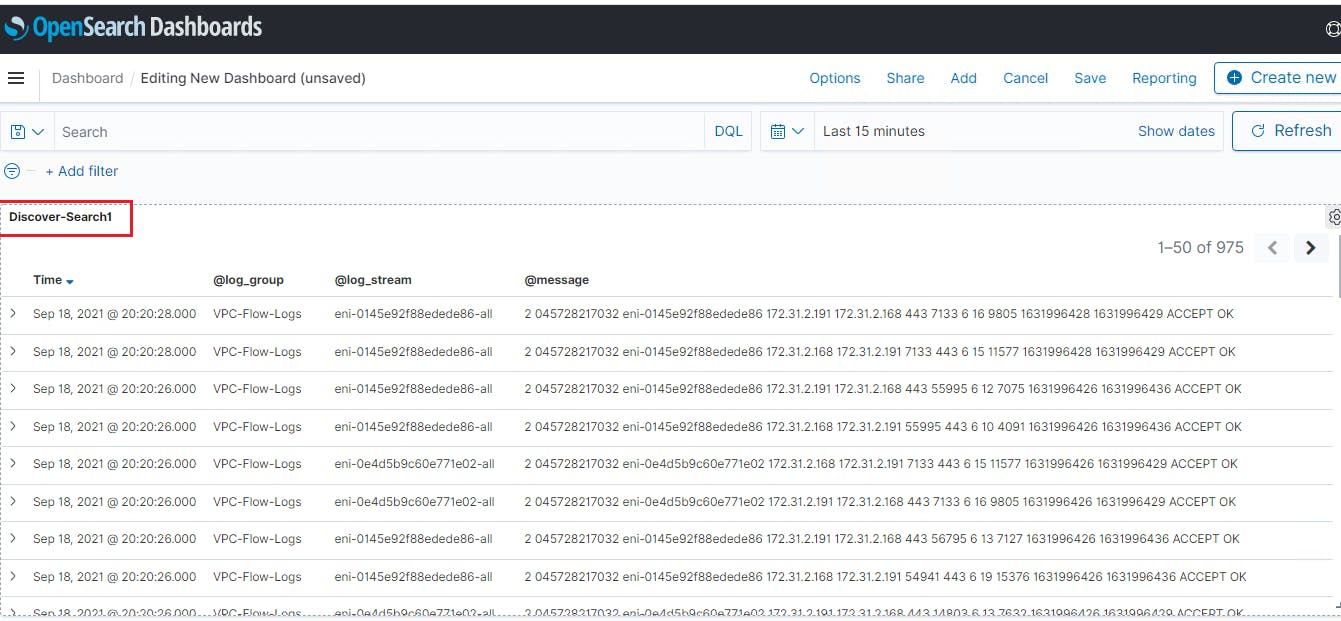
- Then click on save and you dashboard will be created.

- To create visualization goto Visualize from left menu
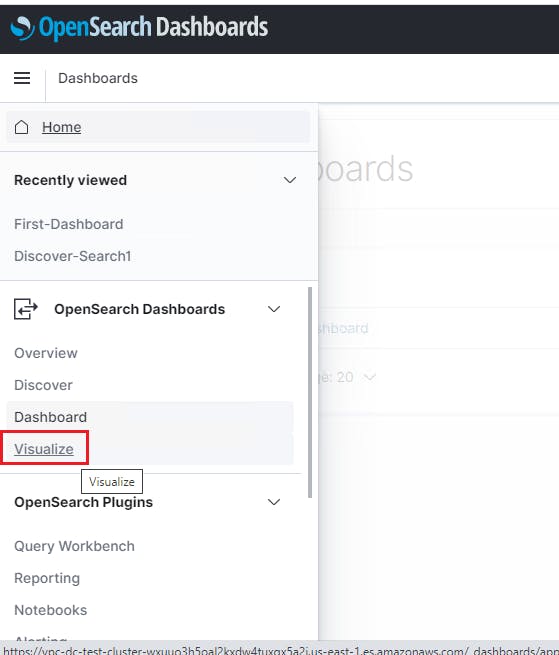
- Create new visualization

- We will select Line type for Visualization
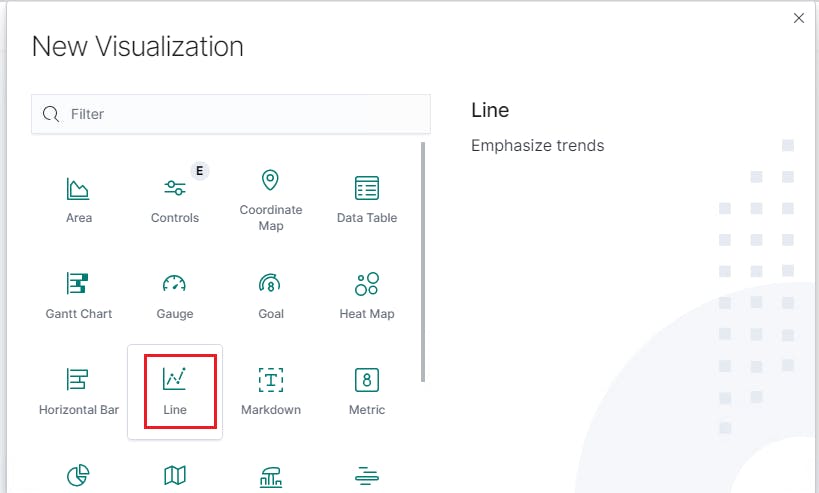
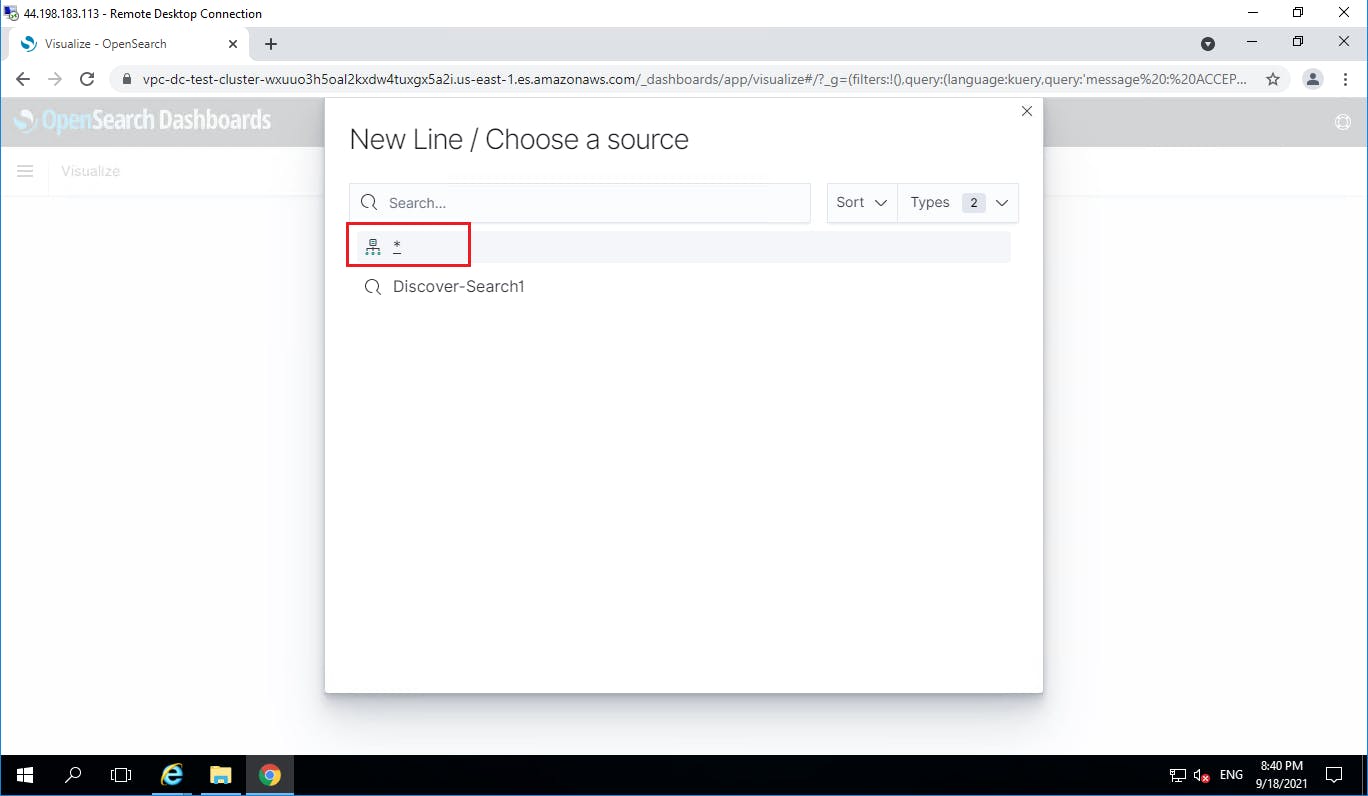
- Select our index pattern
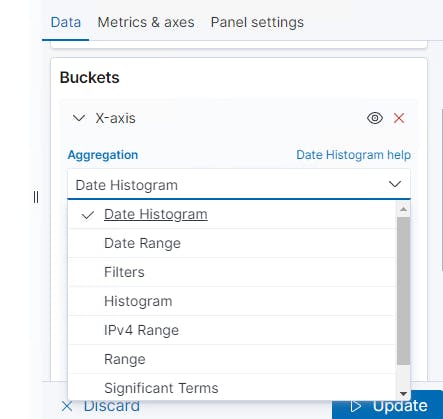
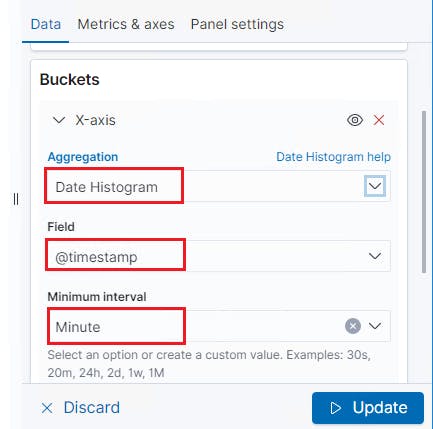
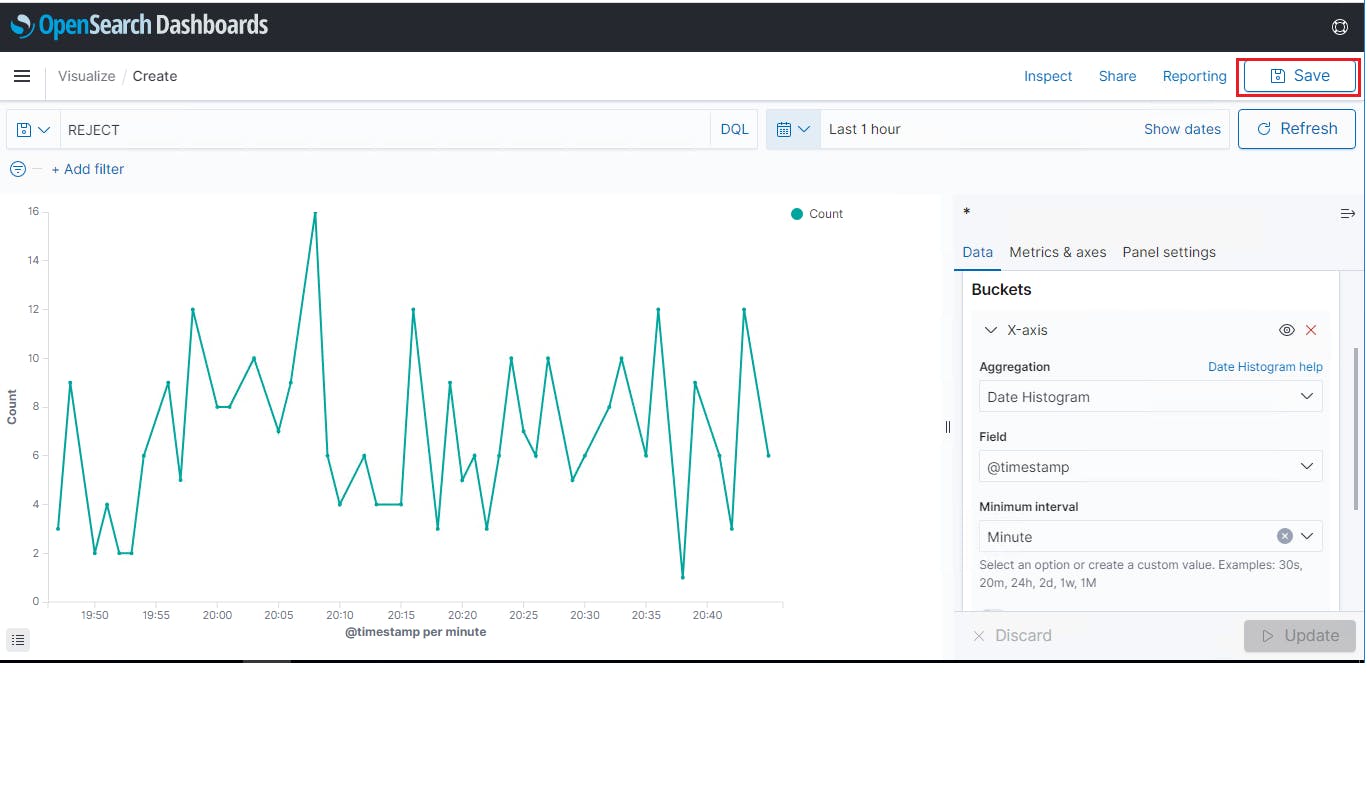
- In bucket select "Date Histogram" in field keep "@timestamp" and minute interval as "minute" and click on update.
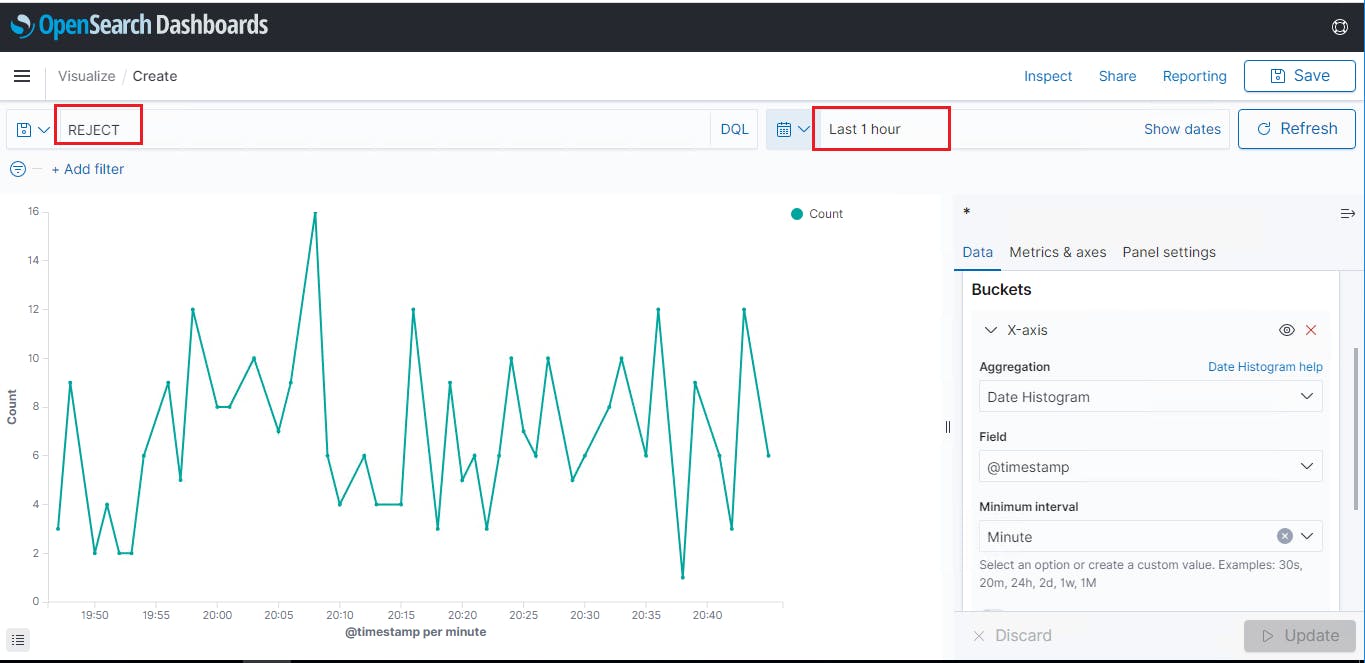
- Below you can see line chart visualization based on "REJECT" keyword and timestamp as last 1 hour.
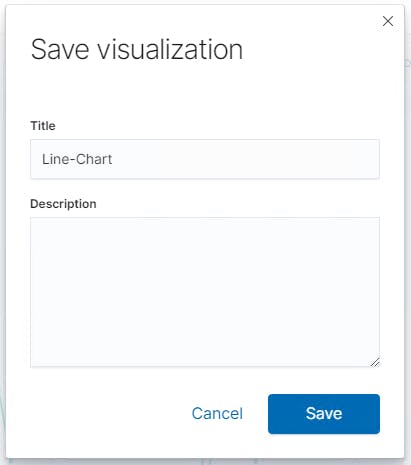
- Now click on save button to save your visualization.
So, did you find my content helpful? If you did or like my other content, feel free to buy me a coffee. Thanks.
